
System Pulse
An iStat Menus-style system monitor for the Omarchy bar.
Glanceable CPU and memory on the Omarchy bar, with a popup that names the process eating your machine. Samples /proc and /sys every 2 seconds. No extra daemons. Ping is off unless you turn it on.
Plugin ID: coding-sparrow.systempulse · Version 1.5.1 · MIT
On the bar (default glance): CPU sparkline + CPU% + memory% — disk, network, and battery stay off so they do not fight stock Omarchy icons:

Click the widget for CPU, memory, and top processes first. Disks, history, and extra bar segments are further down (or behind Bar display).
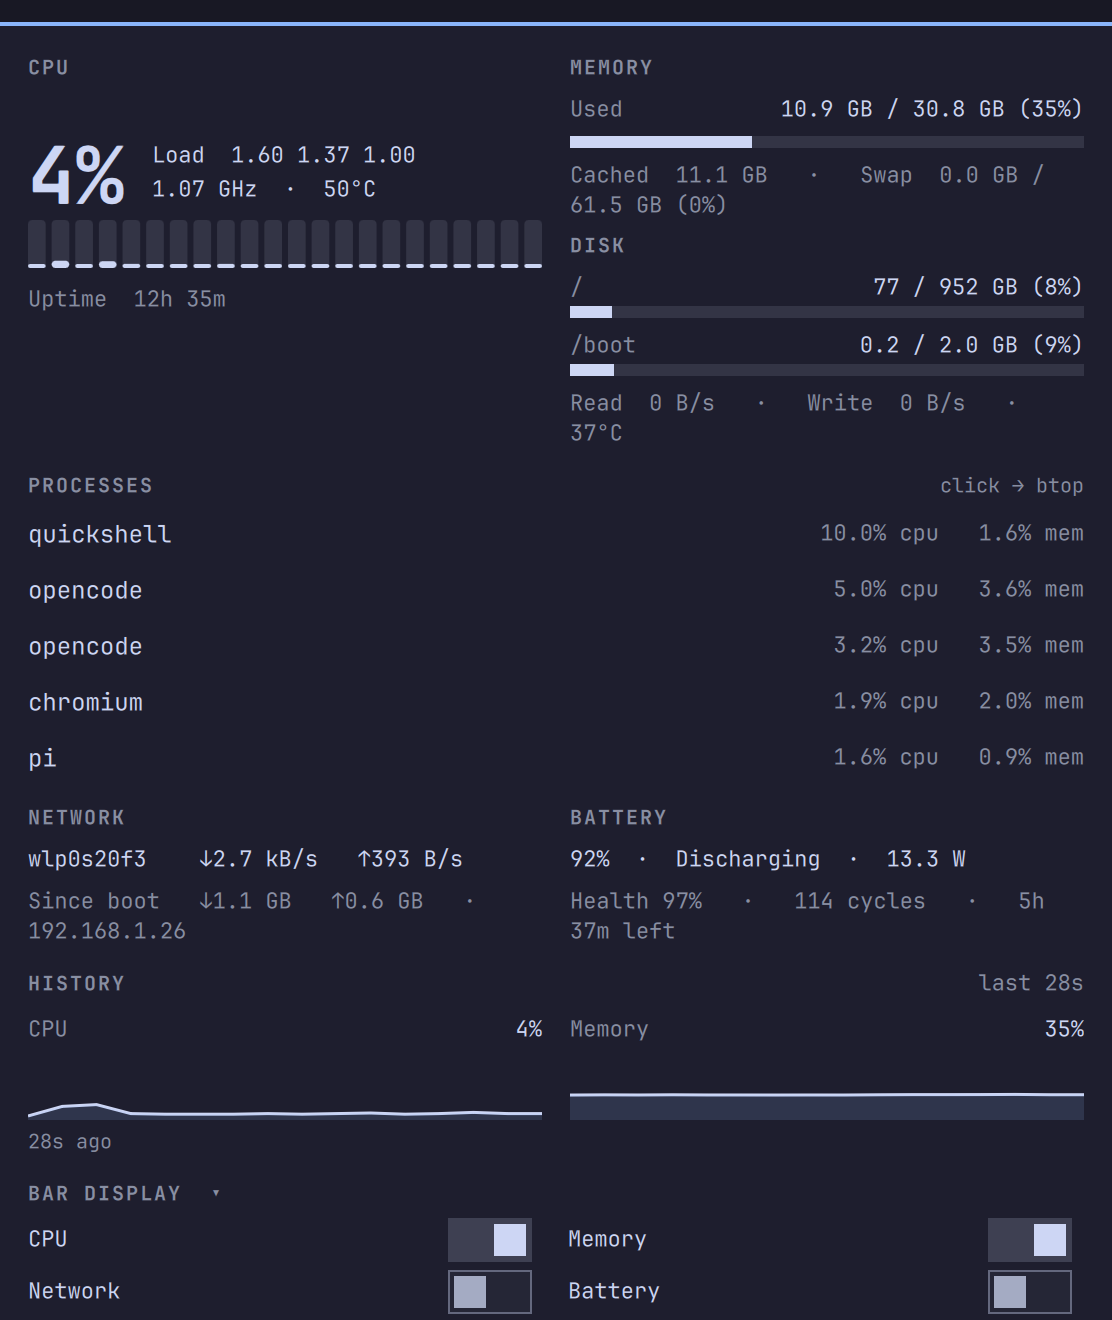
Marketplace: omarchyplugins.com (search System Pulse).
What you see on the bar
Default glance:
▁▂▃ CPU 6% MEM 30%
| Piece | Default | Meaning |
|---|---|---|
| Mini sparkline | on | CPU over recent samples (filled) |
| CPU % | on | Total CPU busy |
| Memory % | on | Used memory (MemTotal − MemAvailable) |
DISK |
off | Root (/) filesystem % — not /boot |
↓ ↑ |
off | Download / upload (Omarchy already has a network icon) |
BAT |
off | Charge % (Omarchy already has a power widget) |
GPU |
auto | AMD gpu_busy_percent, or Intel i915/xe idle residency |
VRAM |
off | GPU memory % (AMD sysfs or nvidia-smi) |
Turn extra segments on under Bar display in the popup. Compact only tightens spacing — names stay on the bar so you can tell CPU from MEM.
Failing resources turn urgent (theme urgent color) — only that segment, not the whole widget.
Hover the widget for a one-line tooltip (CPU, memory GB, network, battery state, package temp).
How to use it
| Action | What happens |
|---|---|
| Left-click the widget | Open / close the detail popup |
| Left-click a segment | Open the popup, highlight that block, scroll to it if needed |
| Click a process in the popup | Open btop in a floating terminal |
| Right-click the widget | Same btop shortcut |
| Bar display ▸ | Extra segments (disk / net / battery / VRAM), compact, ping, notifications |
| Click an alert toast | Opens the popup (toasts are named “System Pulse” and won't sit on top of the widget forever) |
Inside the popup:
- CPU — big %, load averages, frequency, package °C, GPU % if present, per-core bars (any core count), uptime
- Memory — used / total, cached, swap, VRAM when the GPU exposes it
- Disk — each real filesystem (e.g.
/and/boot; bind mounts of the same device are merged), read/write speed, NVMe °C - Network — default iface (IPv4, else IPv6), live ↓/↑, totals since boot, local IP
- Battery — %, status, watts, health vs design, cycles, time remaining / time to full; multiple packs are combined, peripheral batteries (mice, keyboards) ignored
- Processes — top 5 by current CPU (from
/proc/*/statdeltas, liketop; 100% = one core), sampled only while the popup is open - History — sparklines for CPU, memory, network, battery, with
… ago→now(fills up to ~4 minutes at the default interval) - Bar display — toggles that persist to
shell.json
Vertical bars stack the same segments and still color alerts.
Install
omarchy plugin add https://github.com/Coding-Sparrow/omarchy-systempulse.git --enable
Place it on the bar if the installer didn't:
omarchy plugin enable coding-sparrow.systempulse --section right
Update
omarchy plugin update coding-sparrow.systempulse
Hide or remove
omarchy plugin disable coding-sparrow.systempulse   # leave files, hide from the bar
omarchy plugin remove coding-sparrow.systempulse    # delete the checkout
Requirements
- Omarchy with the Omarchy shell / Quickshell bar (4.x)
btop— optional, only for right-click
No other packages. GPU busy, VRAM, battery, NVMe temp, and fans-of-sensors appear only when the kernel (or nvidia-smi) exposes them.
Configure
Easiest: click the widget → Bar display at the bottom. Toggles save themselves.
Or CLI (no JSON editing):
omarchy bar set coding-sparrow.systempulse compactBar true
omarchy bar set coding-sparrow.systempulse showNet false
omarchy bar set coding-sparrow.systempulse showDisk false
omarchy bar set coding-sparrow.systempulse notifications true
omarchy bar set coding-sparrow.systempulse alertTemp 80
omarchy bar set coding-sparrow.systempulse interval 1000
omarchy bar set coding-sparrow.systempulse checkConnectivity true
Or in ~/.config/omarchy/shell.json on the widget entry:
{
  "id": "coding-sparrow.systempulse",
  "compactBar": true,
  "showNet": false,
  "notifications": true
}
Settings
All keys are optional.
| Key | Default | What it does |
|---|---|---|
showCpu |
true |
CPU % + sparkline on the bar |
showMem |
true |
Memory % |
showDisk |
false |
Root filesystem % |
showNet |
false |
↓/↑ on the default route |
showBattery |
false |
Battery % (Omarchy already has a power widget) |
showGpu |
true |
GPU % (AMD sysfs busy, Intel i915/xe idle residency) |
showVram |
false |
GPU memory % (AMD sysfs or nvidia-smi) |
compactBar |
true |
Tighter spacing (names stay visible) |
checkConnectivity |
false |
Periodic ping for packet-loss alerts (off = no extra network) |
interval |
2000 |
Sample period in ms (clamped to 500–10000) |
alertBattery |
20 |
Urgent while discharging at or below this % |
alertTemp |
85 |
Urgent when CPU package °C is at or above this |
alertMem |
95 |
Urgent when used memory % is at or above this |
alertDisk |
90 |
Urgent when any listed filesystem is this full |
notifications |
false |
One desktop notification per alert as it starts; click opens the popup |
pingInterval |
10000 |
Ping period in ms (only if ping check is on) |
netAlertFailures |
3 |
Failed pings in a row before the network segment turns red |
detailCommand |
floating btop |
Command run on right-click |
Alerts
| Condition | Bar |
|---|---|
Battery discharging ≤ alertBattery |
BAT urgent |
CPU package ≥ alertTemp |
CPU urgent |
Memory ≥ alertMem |
MEM urgent |
Any disk ≥ alertDisk |
DISK urgent; notification names the mount |
| Ping check on, and N failed probes | network segment urgent |
Alerts use hysteresis so a reading hovering at the threshold does not flicker: temperature must hold for 3 samples and clears 5 °C below; memory clears 3% below; disk 2% below; battery 2% above. Notifications fire once when an alert starts, and the same alert will not re-toast within 10 minutes. Clicking the toast opens the panel and dismisses System Pulse toasts so they cannot cover the widget.
Hardware notes
Works without extra setup on typical Omarchy laptops and desktops.
- CPU temp: Intel
coretemp(Package id), AMDk10temp/zenpower(Tctl/Tdie), ARMcpu/soc_thermal, thenacpitz - CPU frequency:
/proc/cpuinfoMHz, orcpufreq/scaling_cur_freq(ARM) - Battery:
ENERGY_*orCHARGE_*sysfs (health, watts, time left). Power is converted from microwatts (or µV × µA) to watts. - Network: IPv4 default route first, IPv6 if that's all there is
- GPU: AMD
/sys/class/drm/card*/device/gpu_busy_percent; Intel from i915gt/gt0/rc6_residency_msor xetile0/gt0/gtidle/idle_residency_ms(skipped while the GPU is runtime-suspended, so the widget never wakes it) - VRAM: AMD
mem_info_vram_used/mem_info_vram_total, elsenvidia-smiif installed. Hidden on GPUs that expose neither. - Disks: unique block devices, tmpfs/overlay/ISO skipped;
/preferred over/homewhen they are the same volume. I/O speed sums physical disks (so LUKS/LVM is not double counted, and hot-plugged USB drives are included). Removable media under/run/mediais listed but never triggers the full-disk alert. - Network: the default route with the lowest metric (ethernet beats wifi); clears when you disconnect
How it works
Omarchy shell plugin (Quickshell / QML):
| File | Role |
|---|---|
SysMon.qml |
Bar widget, FileViews, timers, IPC |
Panel.qml |
Detail popup (Panel / KeyboardPanel) |
Sparklines.qml |
History graphs |
Model.js |
Parsing and formatting (/proc, /sys, df, ps) |
Reads kernel interfaces on a timer (/proc/stat, /proc/meminfo, /proc/diskstats, /proc/net/dev, /proc/net/route, /proc/net/ipv6_route, /sys/class/power_supply, /sys/class/hwmon). Discovery of temp/battery/GPU paths runs once at startup.
Does not write anything except its own keys in shell.json. Ping to 1.1.1.1 runs only if Ping check is on.
IPC (optional):
omarchy-shell coding-sparrow.systempulse open
omarchy-shell coding-sparrow.systempulse close
omarchy-shell coding-sparrow.systempulse toggle
omarchy-shell coding-sparrow.systempulse refresh
Develop
After install, the checkout Omarchy already cloned is:
~/.config/omarchy/plugins/coding-sparrow.systempulse/
Edits there hot-reload. Validate and test from that directory:
omarchy plugin validate .
node test/model-test.js
Edits log Local plugin changed, reloading but, on Omarchy 4.0.x, the shell keeps running the old QML/JS from its component cache (basecamp/omarchy#6981); rescanPlugins doesn't help either. Run omarchy restart shell to load your changes. The same applies after omarchy plugin update.
See CHANGELOG.md for 1.2.0 / 1.1.0 notes.
License
MIT © Coding-Sparrow