
Omakuma
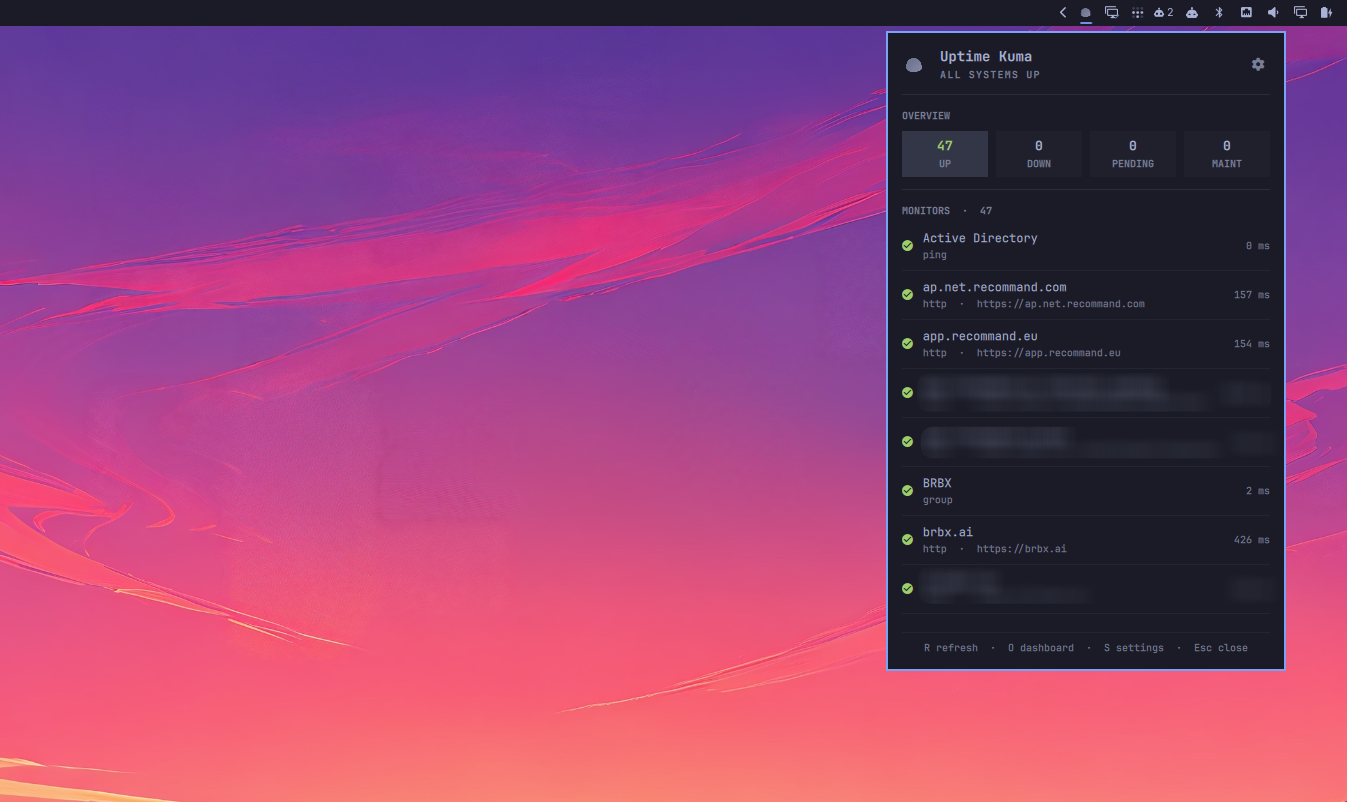
An Omarchy bar widget that shows the status of every active monitor in your Uptime Kuma instance, with a popup panel listing each monitor, its status, and its last response time.
The bar stays quiet while everything is healthy — just the Kuma mark. The moment a monitor goes down the mark turns red and picks up a count.
How it works
The plugin polls Uptime Kuma's Prometheus endpoint (GET /metrics) with an API
key. Uptime Kuma drops paused monitors from that endpoint, so the list is
exactly your active monitors. Status codes map as 0 = down, 1 = up,
2 = pending, 3 = maintenance.
Requirements
- Omarchy 4.x (Quattro shell plugin system)
curlandjq
Install
omarchy plugin add <repo-url> --enable
Or, for local development, symlink a checkout into the plugin directory:
ln -s ~/git/omakuma ~/.config/omarchy/plugins/daan.uptime-kuma
omarchy-shell shell rescanPlugins
omarchy plugin enable daan.uptime-kuma --section right
QML edits under a symlinked checkout are not always picked up by the shell's
file watcher — run omarchy restart shell if a change doesn't appear.
Setup
Click the widget. An unconfigured plugin opens straight into its setup form:
- Instance URL — e.g.
https://kuma.example.com - API key — Uptime Kuma → Profile → Settings → API Keys → Add API Key
Save & test writes the config and immediately reconnects, so a bad URL or
key shows up right there in the panel. Reopen the form any time with the cog in
the panel header or the S key.
Credentials are written to ~/.config/omarchy/uptime-kuma.json with mode
600 — deliberately outside the plugin directory, so this repo can be
committed and shared without leaking the key. The key is passed to the writer
over stdin, never argv, and is never read back into the form: leave the API key
field blank to keep the stored one. Polling also supplies the key to curl over
stdin, keeping it out of local process listings. HTTPS with normal certificate
verification is required so credentials and monitor data are protected in
transit.
UPTIME_KUMA_URL and UPTIME_KUMA_API_KEY override the file when set.
To configure it by hand instead, copy config.example.json to
~/.config/omarchy/uptime-kuma.json. Verify a connection at any time with:
~/.config/omarchy/plugins/daan.uptime-kuma/state.sh | jq
Use
| Action | Result |
|---|---|
| Left-click | Open/close the monitor panel |
| Right-click | Refresh immediately |
| Middle-click | Open the Uptime Kuma dashboard in the browser |
R / Enter in panel |
Refresh |
O in panel |
Open the dashboard |
S in panel |
Open the setup form |
Esc in panel |
Close |
Refresh interval defaults to 30s and is configurable per widget in
~/.config/omarchy/shell.json:
{ "id": "daan.uptime-kuma", "interval": 60 }
Files
| File | Purpose |
|---|---|
manifest.json |
Plugin declaration |
Panel.qml |
Bar widget, monitor panel, and setup form |
state.sh |
Fetches /metrics and emits the state JSON |
parse.jq |
Prometheus text → state JSON |
save-config.sh |
Validates and writes the config file |
assets/ |
The Kuma mark and the script that derives it |
Troubleshooting
The panel replaces the monitor list with the failure and offers Retry and Settings:
- Not configured — no URL stored yet; the setup form opens on its own
- Unreachable — DNS/network/TLS failure, or the instance is down
- Unauthorized — bad or revoked API key
- No /metrics endpoint — the URL points somewhere other than Uptime Kuma
- HTTPS is required — replace a legacy plain-HTTP instance URL with HTTPS
- TLS certificate verification cannot be disabled — remove the legacy
"insecure": truesetting and configure a trusted certificate
Credits
The Kuma mark in assets/ comes from
louislam/uptime-kuma (public/icon.svg,
MIT). assets/uptime-kuma.svg is that file verbatim; assets/regenerate.sh
documents and reapplies the change that makes it legible at bar sizes, and
assets/regenerate.sh --path reprints the outline that Panel.qml fills with
the bar's own colour.
Uptime Kuma is a trademark of its authors; this plugin is an unofficial integration.
License
MIT