
CPU Usage for Omarchy
An iStat Menus-inspired Omarchy Quattro bar widget for live CPU usage, history, temperature, top processes, load averages, and uptime.
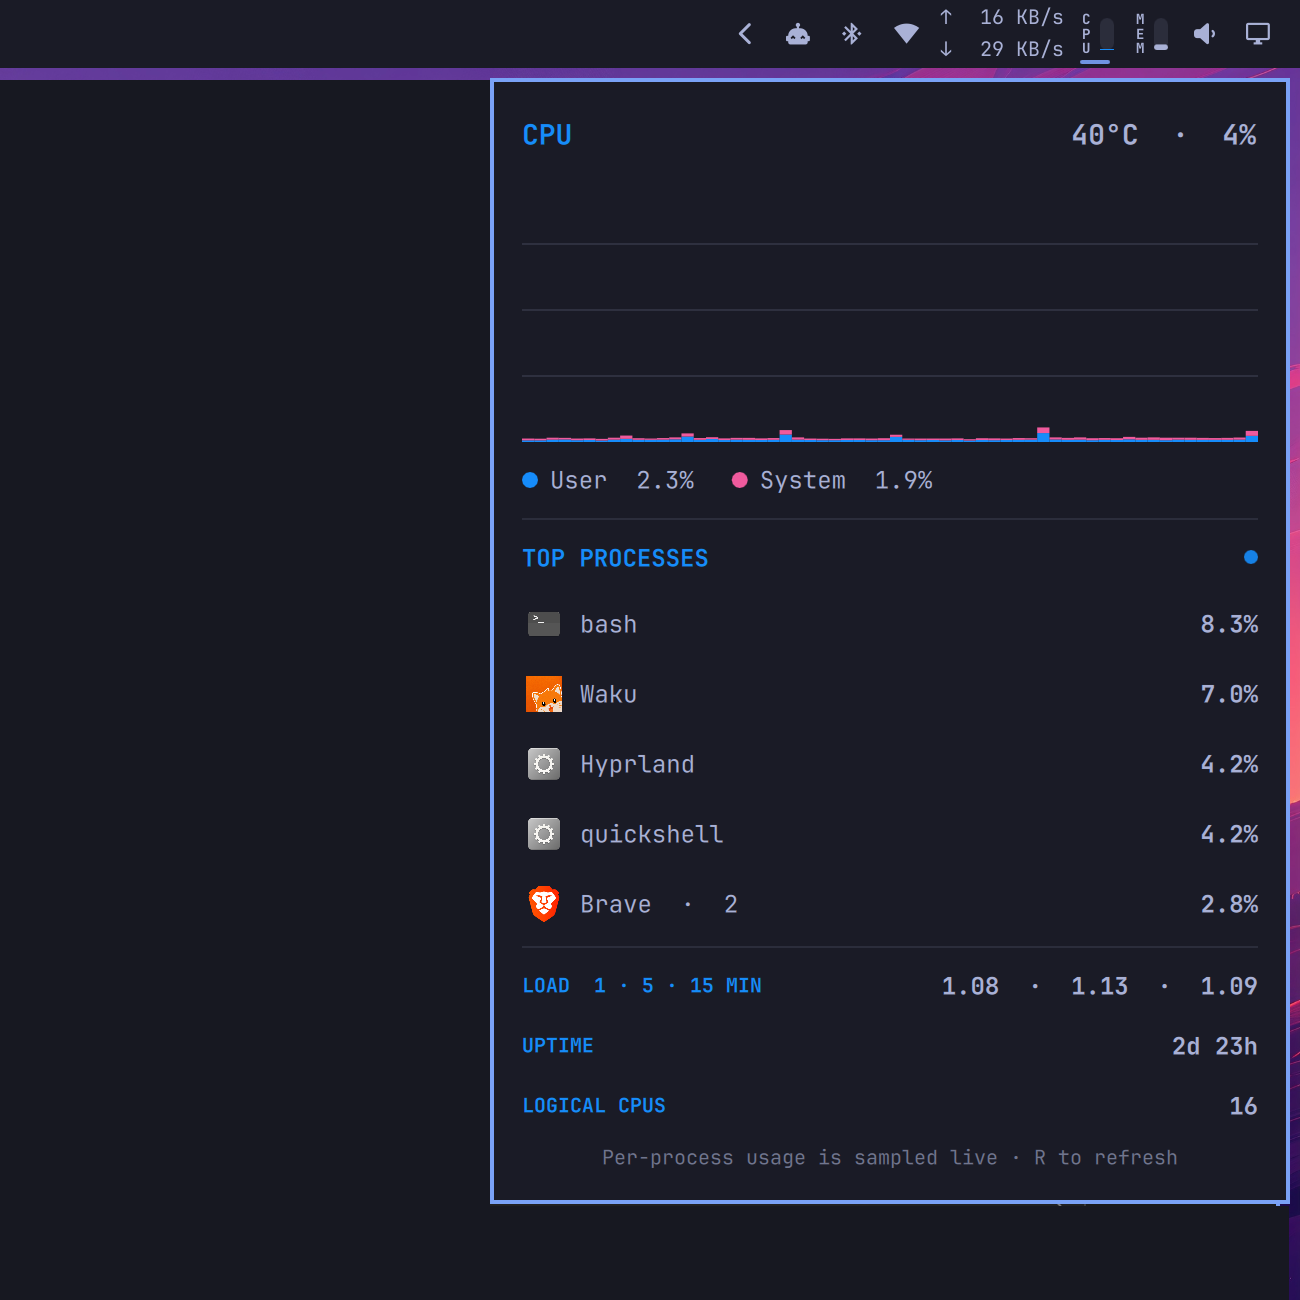
Features
- Compact upright vertical
CPUlabel and adjacent meter, centered in a standard icon slot - Bottom-up stacked meter with blue user time and pink system time
- Sixty-second user/system history graph
- CPU temperature, load averages, uptime, and logical CPU count
- Top processes grouped by executable name, with application icons
- Theme-aware native panel with keyboard and adjacent-panel switching
Install
omarchy plugin add https://github.com/egoist/omarchy-cpu-usage.git --enable
The widget lands in the right section of the bar. Move it if needed:
omarchy bar move dev.egoist.cpu-usage --section right
Configure
Set the fixed horizontal widget width (default 27, the standard icon slot):
omarchy bar set dev.egoist.cpu-usage width 27
Set the number of process rows (default 5, range 1–10):
omarchy bar set dev.egoist.cpu-usage processCount 5
How the metrics work
Overall user and system usage are calculated from deltas in Linux's aggregate /proc/stat CPU counters. The bar keeps the latest 60 one-second samples for its panel graph.
Per-process usage is measured across a live 650 ms sample of each process's user and system CPU counters. Percentages use one logical CPU as 100%, so a multi-threaded process can exceed 100%.
Temperature prefers CPU-specific hwmon sensors such as k10temp and coretemp, with the first readable hwmon temperature as a fallback.
Dependencies and security
The plugin runs unsandboxed with your user permissions, like every Omarchy shell plugin. It does not use sudo, install packages, start services, or access the network.
It reads Linux's /proc and /sys/class/hwmon statistics and uses commands included with a standard Omarchy installation: Bash, awk, sort, head, getconf, date, and jq.
Update
omarchy plugin update dev.egoist.cpu-usage
Remove
omarchy plugin remove dev.egoist.cpu-usage
License
MIT