
System Health
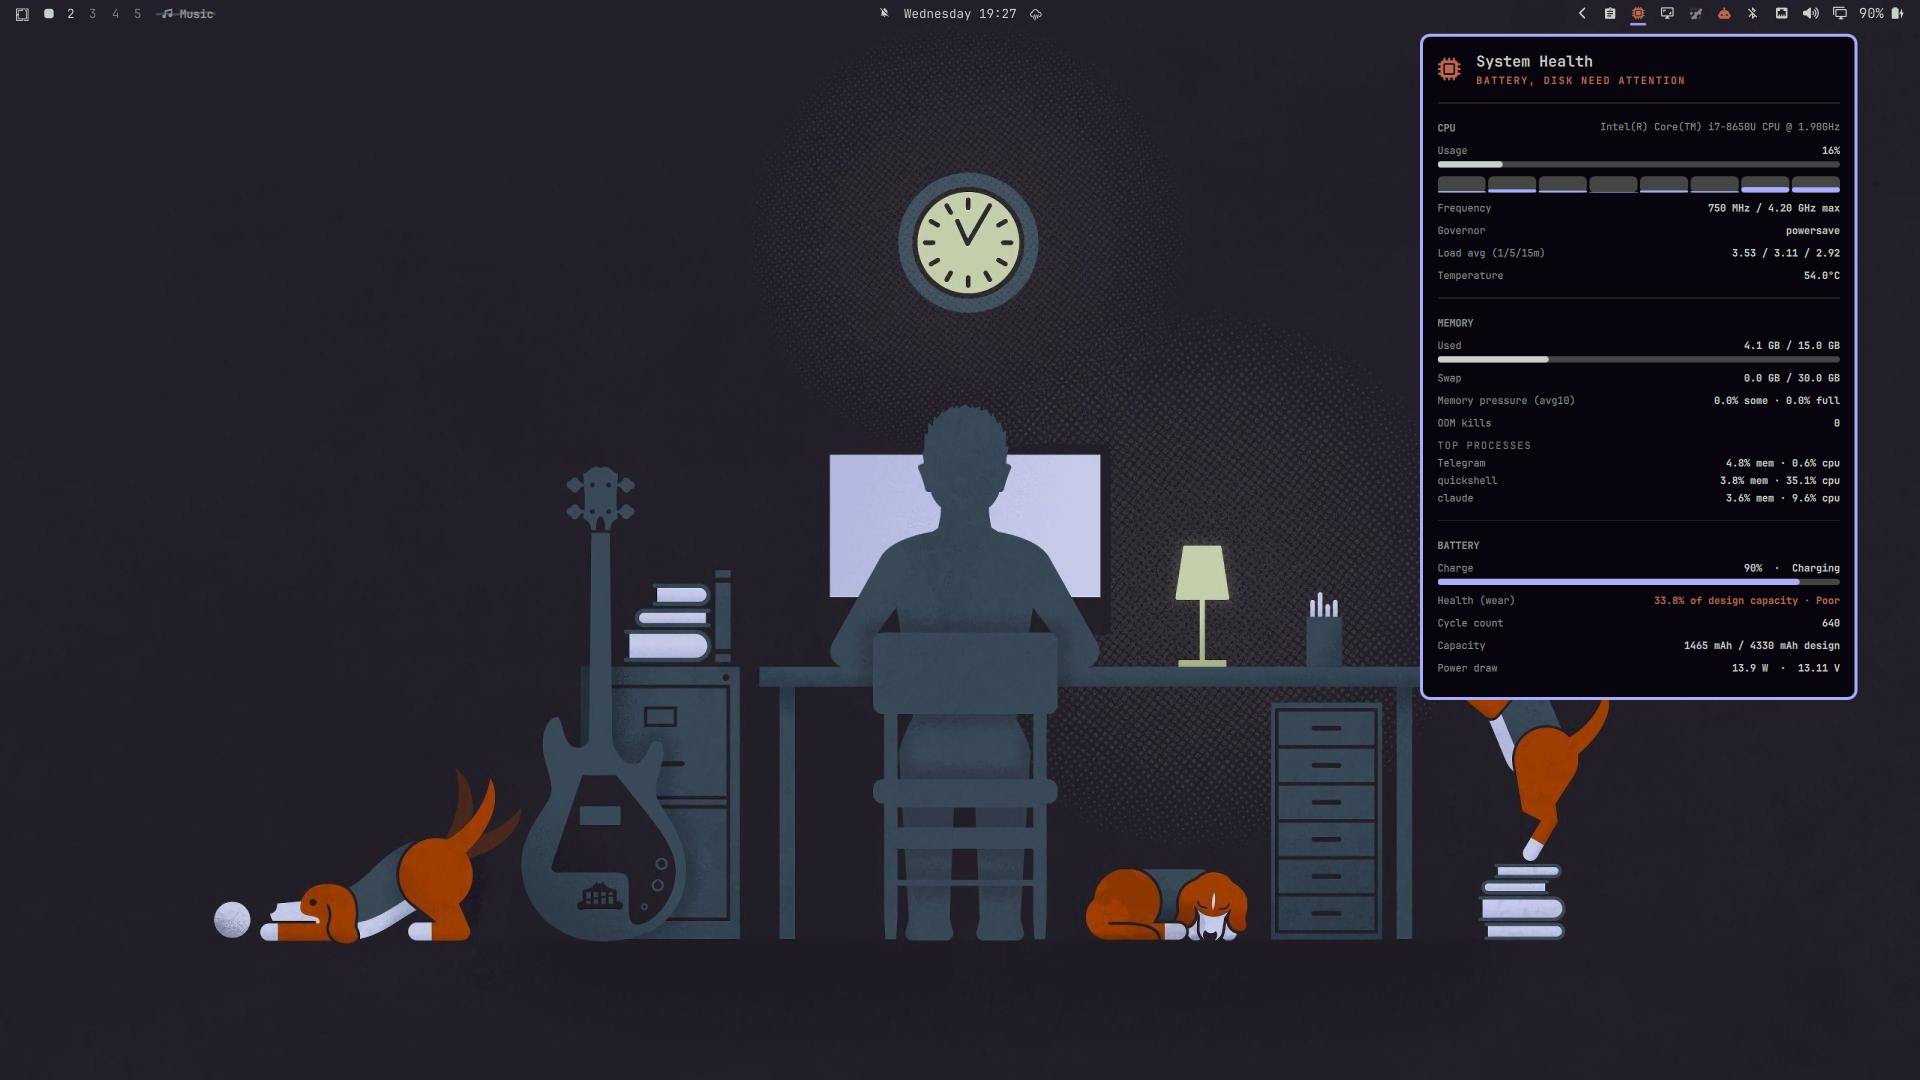
A Task Manager style system monitor for the Omarchy Quickshell bar. CPU, memory, battery, and disk SMART health, all inside the bar, no separate GUI window.
Features
- CPU usage, per-core load, frequency, governor, load average, temperature
- Memory usage, swap, memory pressure, OOM kill count, top processes
- Battery charge, health percentage, cycle count, capacity, power draw
- Disk SMART health via UDisks2 (NVMe critical warnings, ATA failing/bad sector status)
- Bar icon changes color when something needs attention

Requirements
- Omarchy with Quickshell
- Python 3
lm_sensorsfor CPU temperature (optional, install withomarchy pkg add lm_sensors)udisks2for disk SMART health (installed by default on most systems)
No root, sudo, or extra polkit rules needed. Disk SMART data is read through UDisks2's existing D-Bus interface.
Installation
Add it with the Omarchy plugin CLI:
omarchy plugin add https://github.com/DevInBlack001/omarchy-system-health --enable
Or manually: clone into your Omarchy plugins directory, then enable it.
git clone https://github.com/DevInBlack001/omarchy-system-health ~/.config/omarchy/plugins/devinblack001.sysinfo
omarchy plugin enable devinblack001.sysinfo right
Then reload the shell:
omarchy restart shell
Updating
Pull the latest changes for this plugin (or all git-managed plugins):
omarchy plugin update devinblack001.sysinfo
omarchy plugin update   # update every installed git-managed plugin
Removing
omarchy plugin remove devinblack001.sysinfo
Then reload the shell:
omarchy restart shell
Usage
Click the chip icon in the bar to open the panel. It refreshes every 3 seconds while open, and every 20 seconds in the background.
License
MIT, see LICENSE.