
Vitals



A lightweight Omarchy / Hyprland status-bar plugin for CPU, GPU, memory, disk, network, and temperatures. Native Quickshell widget — not a Waybar script.
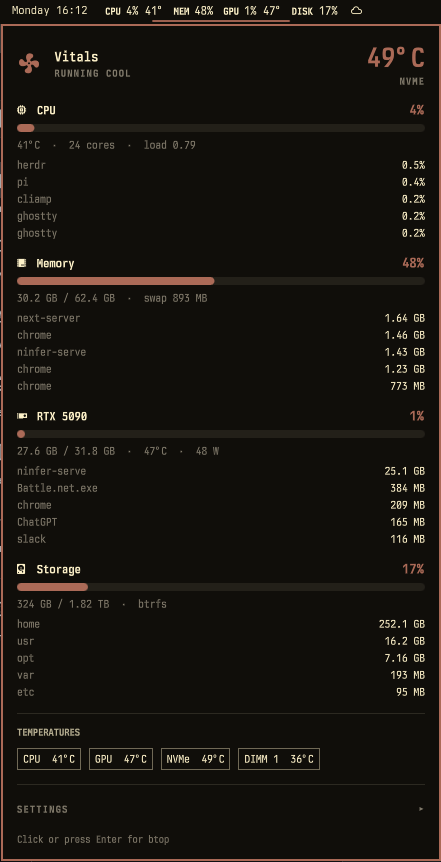
- CPU, memory, GPU (NVIDIA via
nvidia-smi, AMD via sysfs), disk, network, and hwmon temps - Click the bar for meters, top processes, and largest directories
- Follows the active Omarchy theme (accent / muted / urgent)
- Settings live in the panel accordion — poll rate,
CPU/MEMtext labels, units
Requirements
- Omarchy Quattro with Quickshell
python3(standard library only — no pip packages, no extra install)
Optional:
nvidia-smifor NVIDIA GPUs (AMD is read from sysfs)btopif you want the click action or Enter key to open a TUI monitor
The collector reads /proc, /sys/class/hwmon, and /sys/class/drm, and
writes only under $XDG_RUNTIME_DIR. No sudo or pkexec is required. The
plugin does not install services or start a second Quickshell process.
Install
omarchy plugin add https://github.com/thehamsti/omarchy-vitals.git --enable
That clones the plugin into ~/.config/omarchy/plugins/hamsti.vitals/, validates
the manifest, and places the widget on the right side of the bar. Move it
afterward with:
omarchy bar move hamsti.vitals --section center --after omarchy.clock
Update later with omarchy plugin update hamsti.vitals.
Remove
omarchy plugin remove hamsti.vitals
What you get
Bar
12% 51° 34% 4% 45° ↓1.2 MB/s ↑256 KB/s
GPU hides itself when no supported GPU is found. Disk is off by default so the strip stays short; turn it on if you want capacity in the bar.
Panel
Usage bars for CPU, memory, each GPU, and each real filesystem, plus a temperature chip list. While the panel is open it also lists the top processes for CPU, memory, and GPU VRAM, and the largest top-level directories on each disk. Values flip to the theme urgent color at the warning thresholds.
Those extras never run on the bar refresh path. Process lists are sampled only while the panel is open; directory sizes are measured in a niced background job and cached for 15 minutes.
CPU percent is shared across every bar instance and EMA-smoothed. Two monitors
used to sample /proc/stat a few milliseconds apart and invent fake spikes;
sub-second windows are ignored now.
Clicks
| Input | Action |
|---|---|
| Left | Open the panel (or btop, if you change Left click) |
| Right | Open btop |
| Middle | Refresh now |
| Hover | Nothing — click for the panel |
Settings
Open the panel and expand Settings at the bottom. Clicks write the same
keys as omarchy bar set and take effect immediately. Poll is the bar
refresh interval. Text swaps the glyphs for CPU / MEM / GPU.
You can still set them from the CLI or by editing the bar entry in
~/.config/omarchy/shell.json.
{
  "id": "hamsti.vitals",
  "display": "All",
  "showCpu": "On",
  "showMemory": "On",
  "showGpu": "On",
  "showDisk": "Off",
  "showNetwork": "On",
  "showTemp": "On",
  "compact": "Off",
  "barStyle": "Icons",
  "tempUnit": "C",
  "refreshIntervalSec": 2,
  "warnPercent": 90,
  "warnTempC": 85,
  "diskMount": "/",
  "clickAction": "Panel"
}
display can be All, CPU, Memory, GPU, Disk, Network, or Temp. The plugin
allows multiple instances, so you can split the strip:
omarchy plugin enable hamsti.vitals --section right
omarchy bar set hamsti.vitals display CPU
Then enable another copy and set that one to Memory.
How it reads the machine
collect.py is a no-dependency Python 3 snapshot. The bar calls it every couple
of seconds; the panel calls collect.py --extras only while it is open.
/proc/statfor CPU percent (previous sample kept in$XDG_RUNTIME_DIR, minimum 0.8s window, light EMA)/proc/meminfofor memory and swapnvidia-smifor NVIDIA GPUs,/sys/class/drmfor AMD/proc/self/mounts+statvfsfor real disks/proc/net/devfor network upload/download rates/sys/class/hwmonfor temperatures--extras:/proc/*/stat+/proc/*/statmfor top processes,nvidia-smi --query-compute-appsfor GPU VRAM, cacheddu -s -xfor top-level directories
The first CPU sample after login has no previous counter, so usage shows —
for one refresh interval.
Develop
./scripts/check.sh
python3 collect.py --pretty
python3 collect.py --extras --pretty
Saving files under ~/.config/omarchy/plugins/hamsti.vitals/ reloads the
widget automatically. Force a rescan with omarchy-shell shell rescanPlugins.
See CONTRIBUTING.md for PR and release steps.
./scripts/release.sh # tags v2026.08.17