
Vital Signs
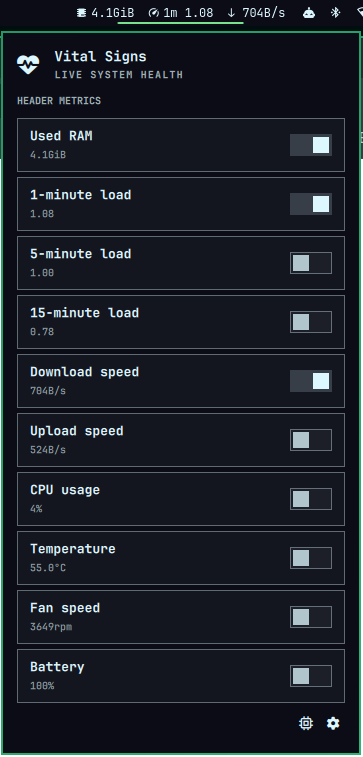
An Omarchy 4 shell plugin that displays selectable live system metrics in the bar. Click the status line to choose metrics; use the settings page to control the refresh rate, bar alignment, empty-value visibility, and metric icons. The Advanced page lists top CPU and RAM processes owned by the current user, with confirmed termination actions, plus a separately confirmed privileged kernel OOM trigger.

Requirements
- Omarchy 4 with
omarchy-shell - A Linux system exposing metrics through
/procand/sys - Standard Omarchy command-line tools: Bash,
awk, GNUps,getconf, andpkexec
Installation
Install and enable the plugin directly from GitHub:
omarchy plugin add https://github.com/harel/omarchy-vital-signs.git --enable
The command asks for confirmation because Omarchy plugins run inside the long-lived shell process. After installation, Vital Signs appears in the bar's right section by default.
To update an existing installation:
omarchy plugin update harel.vital-signs
To remove it:
omarchy plugin remove harel.vital-signs
Local development
Clone the repository anywhere, then symlink it into Omarchy's user plugin directory:
git clone https://github.com/harel/omarchy-vital-signs.git
cd omarchy-vital-signs
mkdir -p "$HOME/.config/omarchy/plugins"
ln -s "$PWD" "$HOME/.config/omarchy/plugins/harel.vital-signs"
omarchy-shell shell rescanPlugins
omarchy plugin enable harel.vital-signs
After changing QML or scripts behind the development symlink, restart the shell to ensure the linked source is reloaded:
omarchy restart shell
Use omarchy-shell shell rescanPlugins when adding a new plugin or entry point.
Process monitoring
Process collection runs only while the Advanced page is open. The settings page offers two CPU calculation modes:
- Live delta (default) calculates CPU usage from kernel tick differences between samples. RAM appears after the first sample; CPU appears after the second, with a measuring message shown in the meantime.
- ps average uses GNU
pslifetime-average CPU values and appears after the first sample.
By default, CPU follows the familiar top/ps per-core convention: 100% means
one logical CPU is fully occupied, so a multithreaded process can exceed 100%.
Disable Use per-core CPU percentage to normalize each process against the
machine's total logical CPU capacity instead.
The collector excludes itself and its sampling children from the results.
Notes
- Network speed is the combined receive rate for all non-loopback interfaces.
- Battery percentage is read from the first battery exposed in Linux sysfs.
- Temperature and fan availability depend on what the kernel exposes through
/sys/class/hwmon; unsupported hardware is shown as “Not reported”. - All metrics are read locally without root privileges.
- The process list is restricted to the current user's processes. Termination
sends
SIGTERMwithout privilege escalation after an in-panel confirmation and revalidates the PID, process name, ownership, and kernel start time to protect against PID reuse. - The kernel OOM trigger is an intentionally destructive emergency control. It
requires a separate in-panel confirmation followed by
pkexecauthorization, then writesfto/proc/sysrq-trigger. The kernel chooses a memory-consuming process to kill; this can cause data loss or destabilize the session.