
Vitals
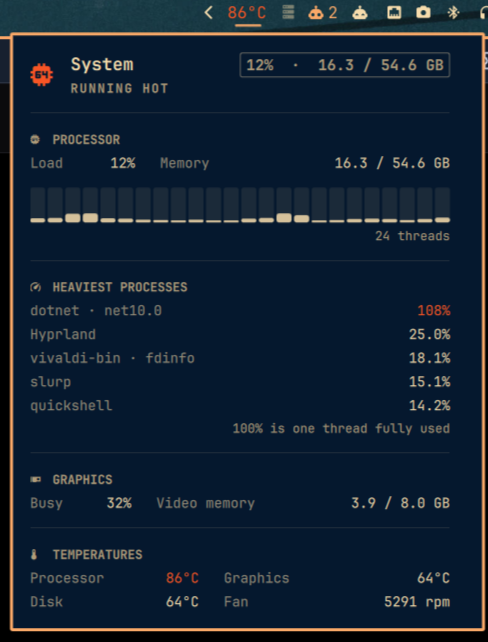
A bar widget for Omarchy Quattro. The bar shows the processor temperature. Click it and a panel drops down with processor load, a bar per thread, memory, graphics use, video memory, the five busiest processes and the temperature readings.
Install
omarchy plugin add https://github.com/dotnetemmanuel/omarchy-vitals --enable
The widget appears on the right of the bar. To place it yourself, run
omarchy plugin enable io.github.dotnetemmanuel.vitals with a placement instead.
Remove
omarchy plugin remove io.github.dotnetemmanuel.vitals
That deletes the plugin folder. Nothing else is left behind: the only files it ever writes are its own sample counters under the runtime directory, and those are gone on the next reboot.
Using it
Left-click the bar entry to open or close the panel. Right-click it to open
btop instead, which focuses an already running btop rather than starting a
second one. With the panel open, r refreshes immediately, the arrow keys
scroll, Tab moves to the next bar panel and Esc closes it.
Hovering a thread bar names that thread and its load. Process percentages use the same convention as top and btop, where 100% means one thread fully used, so a program spread over four threads can read 400%.
Anything the machine cannot report is drawn as -- rather than as a zero.
What it can read
Load, the per-thread bars, memory and the busiest processes come from /proc
and work on any machine.
The rest is found by sensor name, so a reading appears when your hardware presents a sensor the plugin knows to look for.
| Reading | Covers |
|---|---|
| Processor temperature | AMD Ryzen (k10temp, zenpower) and Intel (coretemp, x86_pkg_temp) |
| Graphics load | AMD (amdgpu) and Intel (i915, xe) |
| Graphics temperature | Cards whose driver reports one: amdgpu, radeon, nouveau, Intel Arc |
| Video memory | Cards with memory of their own, so AMD and discrete Intel |
| Disk temperature | NVMe drives, and SATA drives with drivetemp loaded |
| Fan speed | ThinkPad, Asus, Dell and Apple laptops by name, then any other machine whose sensors report a fan at all |
Two readings stay at -- on an ordinary Intel laptop, and that is the honest
answer rather than a gap. Integrated graphics have no memory of their own, they
borrow the system memory already shown above. And the graphics core on an Intel
laptop has no temperature sensor separate from the processor it sits on, so the
processor reading already covers it.
An Nvidia card stays at -- unless it is running on the open nouveau driver.
The proprietary driver reports through nvidia-smi rather than through the
kernel, and this plugin only reads the kernel.
Intel does not count how busy the graphics core is, it counts how long the core
was asleep, so the load shown is the share of the gap between two readings that
was not sleep. It matches what intel_gpu_top shows for overall busy time.
If a reading you expect stays at --, open an issue saying what sensors
prints and I will add your hardware.
Requirements
Omarchy Quattro, and btop if you want the right-click shortcut. Everything else
is bash and awk, already on any Omarchy install. The plugin reads only sysfs and
/proc, needs no privileges, and makes no network connections.
License
MIT. See LICENSE.