
Developer Control Center
An Omarchy bar widget that answers one question from one keyboard-first panel: what development state have I left running on this machine? Projects, containers, services, ports, SSH hosts, and what needs attention — then a way straight into the tool that fixes it.


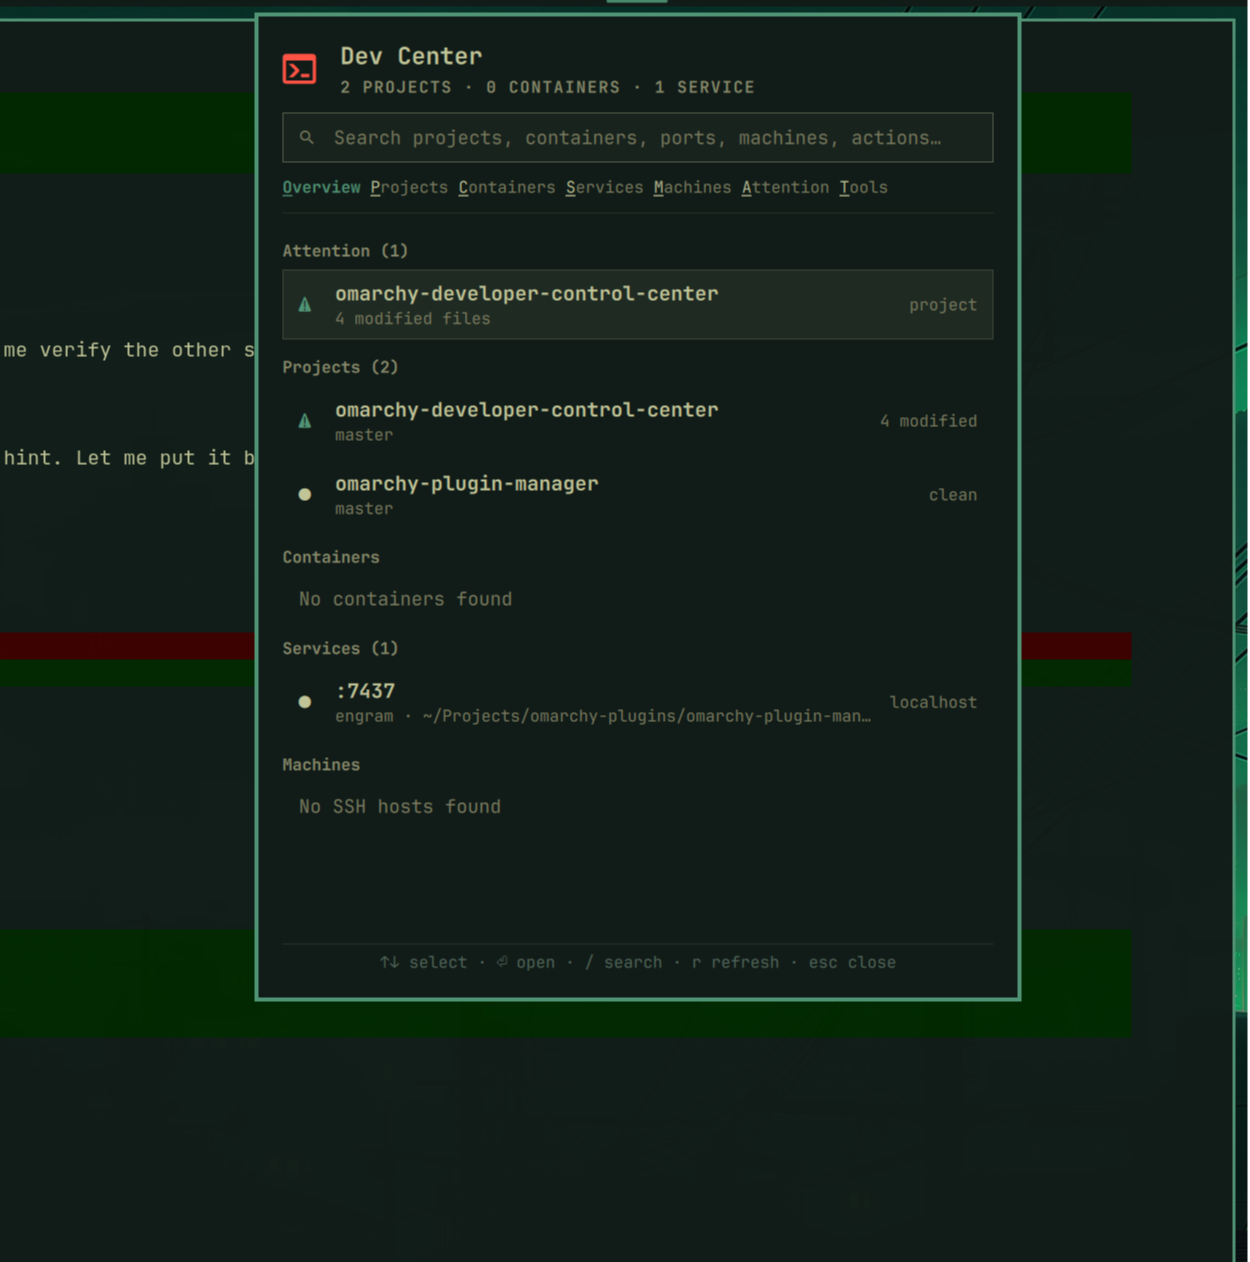
What it does
The bar carries one compact status — DEV ● when nothing needs you, DEV ⚠ 2
when something does. Click it, or bind a key, and the panel opens on an
overview of everything discovered.
Projects
Every git repository under your project roots, with its branch and what is
actually pending: modified, staged and untracked counts, commits ahead or
behind upstream, and merge conflicts. A repository that cannot be read says
unreadable rather than quietly showing clean — those two are not the same
thing, and a plugin that renders them identically is lying to you.
Repositories needing attention sort to the top, so the list answers "what did I leave half-finished" without scrolling.
Selecting one opens its git facts and its actions: open a terminal there, open your editor, open lazygit, copy the path, open the remote in a browser.
Containers
Every Docker container, grouped by Compose project, with health and uptime for running ones and the exit code for the ones that died. Crashed containers sort first, then unhealthy, then running, then cleanly stopped.
Docker being absent is a state, not an error: the panel says Docker not detected and, when the daemon reports why, passes that reason through. The rest of the plugin carries on.
Actions: logs, shell, restart, stop, start, copy the container ID, open lazydocker. Restart and stop are marked destructive and ask before they run.
Services and ports
Listening TCP ports with the process that owns them, its working directory, and the project that directory belongs to. Ports published by a container are attributed to that container instead.
Technology detection is best effort and says so. A next dev command line
reads as Next.js; a bare node reads as Node.js; port 5432 with no
visible owner reads as PostgreSQL? — with the question mark, because a
conventional port is a guess and pretending otherwise is how you end up
debugging the wrong process.
Ports that nothing can be said about — no visible owner, no container, no conventional meaning — are left out. They are usually other users' daemons, and a list of bare numbers buries the servers you actually started.
Actions: open in the browser, copy the URL, jump to the owning project or container, open a terminal there, inspect the process, stop it.
Machines
Hosts from ~/.ssh/config, including Included files, with their hostname,
user, port and reachability. Wildcard patterns and Match blocks are skipped —
they are rules, not machines you can connect to.
Only what is needed to display and open a connection is parsed. Identity files, proxy commands and every other option are dropped on the floor; this plugin never reads a key.
Actions: connect over SSH, open a terminal, ping, copy the hostname or address.
Attention
One list of everything wrong, consolidated across git, Docker and machines, errors first:
✕ conflicted          merge conflict
✕ integration-tests   container exited unexpectedly (1)
⚠ backend-api         3 modified files
⚠ frontend            4 commits behind origin/develop
⚠ postgres            container unhealthy
Selecting an item hands you the underlying resource's actions — the Control Center identifies the problem and delegates the fixing to the tool built for it.
Every rule can be switched off in settings, and the bar count follows whatever you leave on.
Search
Press / and type. One query spans projects, containers, services, ports,
machines, tools and actions:
plug
─────────────────────────────
Project  · omarchy-plugin-manager
Service  · :7437
Action   · Open omarchy-plugin-manager terminal
Action   · Open omarchy-plugin-manager in editor
Action   · Open omarchy-plugin-manager in lazygit
Matches score by position — a name that starts with your query beats one that merely contains it — so the thing you meant is usually already selected.
Tools
Installed developer tools grouped by category, with the ones that can be launched marked. Missing tools do not appear in the launcher: an entry that can only fail is worse than no entry. Nothing is ever installed for you.
Keyboard
↑ ↓ / j k     Move
⏎             Open, or run the selected action
esc           Back — closes a dialog, then a detail, then a search, then the panel
/             Search
o p c s m a t Overview, Projects, Containers, Services, Machines, Attention, Tools
r             Refresh everything
tab           Switch to the neighbouring bar panel
Single letters are section shortcuts and / starts a search, rather than any
letter falling into the search box. Both behaviours are tempting and they are
mutually exclusive: with letters doing double duty, typing plug jumped to
Projects on p, ate l as a movement key, and arrived as ug. One key, one
meaning.
Each section name in the panel underlines the letter that jumps to it, so the shortcut is shown where you are already looking rather than spelled out again in a footer — which is what the hint line was doing until it grew wider than the panel.
Install
omarchy plugin add https://github.com/juancasanueva/omarchy-developer-control-center.git
omarchy plugin enable io.github.juancasanueva.developer-control-center right
Bind a key by adding this to ~/.config/hypr/bindings.lua:
o.bind("SUPER + CTRL + D", "Dev Center", "omarchy-shell shell toggle io.github.juancasanueva.developer-control-center")
Remove
omarchy plugin disable io.github.juancasanueva.developer-control-center
omarchy plugin remove io.github.juancasanueva.developer-control-center
Disabling takes the widget out of the bar and stops the background service;
removing deletes the plugin folder. Either way nothing else on your system is
touched — this plugin writes no files outside its own directory, installs
nothing, and changes no configuration but its own entry in
~/.config/omarchy/shell.json, which disable removes. If you added the
keybinding above, delete that line from ~/.config/hypr/bindings.lua.
Settings
Everything is optional; the plugin is useful with none of it. Set values from
the Omarchy settings UI, or with omarchy bar set:
omarchy bar set io.github.juancasanueva.developer-control-center barFormat compact
omarchy bar set io.github.juancasanueva.developer-control-center projectRoots '["~/Projects","~/Work"]' --json
| Key | Default | What it does |
|---|---|---|
projectRoots |
~/Projects, ~/Developer, ~/Code, ~/Work, ~/src |
Where to look for git repositories |
scanDepth |
2 |
How deep under each root to look |
barLabel |
DEV |
Text in the bar |
barFormat |
full |
full → DEV ⚠ 2, rich → DEV 5 ● 2 ⚠, compact → ⚠ 2 |
editor |
Omarchy's default editor | Command for "Open editor" |
terminal |
system default terminal | Command for "Open terminal" |
gitUi |
lazygit |
Command for "Open git UI" |
containerUi |
lazydocker |
Command for "Open container UI" |
gitRefreshInterval |
60 |
Seconds between repository scans |
dockerRefreshInterval |
15 |
Seconds between container polls |
serviceRefreshInterval |
10 |
Seconds between port scans |
machineRefreshInterval |
120 |
Seconds between re-reads of ~/.ssh/config and host pings |
probeMachines |
true |
Whether to ping SSH hosts at all |
expectedPorts |
none | {"8080": "backend-api"} — warns when something else takes the port |
attention |
all on except machineUnreachable |
Which warnings count |
The last three take a list or an object, which the plugin settings form has no
field type for, so they are set with --json as above or by editing the entry
in ~/.config/omarchy/shell.json directly. Everything above them appears in
the settings UI.
Vertical bars get the glyph and count stacked instead of the full label, so the widget stays readable in a 28 px strip.
How it works
scripts/*.sh   →   Model.js   →   Service.qml   →   BarWidget.qml
 discovery         parsing +       timers and        one status glyph
                   every rule      subprocesses            │
                        ↓                                  ↓
                   Panel.qml  ←────────────────────  Panel.qml
                   renders rows, turns keys into the next state
Discovery runs in short-lived shell scripts, each one wrapped in timeout
so a wedged repository or an unreachable host cannot stall anything. They run
in the background service, which the shell loads exactly once no matter how
many monitors your bar spans.
Every rule lives in Model.js — parsing, status, sorting, grouping,
attention, search scoring, the keyboard reducer, and the argv of every action.
It holds no Qt types, so all of it is tested with node outside a running shell:
node --test test/model.test.mjs
The panel renders rows and dispatches effects. It decides nothing itself: key presses go to the reducer, the reducer returns the next state plus an effect, and the panel runs it. That is why the navigation, the confirmations and the commands are all covered by tests rather than by clicking around.
Failure is a state, not a crash
Plugins run inside the long-lived omarchy-shell process, so this one is
defensive on purpose:
- A failed scan leaves the previous result on screen. Blanking the panel because one poll failed loses information the user could read a second ago.
nullmeans "could not read" and[]means "read fine, nothing there". The panel renders those differently, every time.- Malformed JSON lines, unparseable
ssrows and broken repositories are skipped individually; one bad entry never takes out the scan around it. - Every recurring discovery producer caps its output in bytes at the source,
and
Model.jscaps parser entry counts. The bounded file reads also validate the collector's raw byte length before accepting decoded text. The scans run on a timer inside a process that lives for the whole session, so no single machine — a thousand containers, a repository with a huge untracked tree — can make one of them allocate without bound. - That includes the two files read rather than scanned. The SSH producer opens
each top-level or
Includesource once, refuses a symlink in the final path component, immediately validates that same descriptor as a regular file, and copies at most 256 KiB plus one byte from that descriptor into a private snapshot. Intermediate directory symlinks may still be followed.Includeglobs are traversed one component at a time, with cumulative NUL-delimited match metadata capped before Bash materializes or processes paths. Omarchy's default-editor file is likewise read withhead -c. Both producers report overflow via exit status 65. Only a source that disappears withENOENTis skipped;ENOTDIR, permission, type, and traversal failures abort the transaction. SSH output is capped at 256 KiB and is published only after every source, expansion, and output check succeeds; an oversized editor path is also withheld because a half path could name the wrong binary. - External commands use argv arrays. Potentially blocking scans and probes are
timeout-wrapped. Every SSH source snapshot also runs under a finite two-second
TERM deadline followed by KILL one second later, so a replaced or hostile
source cannot leave the recurring collector stuck. Nothing discovered on your
machine is ever spliced into a shell string, and
identifiers that would travel as arguments are rejected if they could pass
as options — an SSH alias called
-oProxyCommand=…gets no Connect action. - Actions are detached, so they survive the plugin reload that a code change triggers.
Privacy
Everything is local. Nothing is sent anywhere, there is no account, no telemetry, and no network call except the SSH host pings you can switch off.
Development
./sync.sh                                    # copy into ~/.config/omarchy/plugins and rescan
node --test test/*.test.mjs                  # model and producer boundaries
journalctl --user -t omarchy-shell -f        # QML errors
sync.sh copies rather than symlinks because the shell's plugin watcher does
not follow symlinks — a symlinked checkout looks installed but never
hot-reloads.
Requirements
Omarchy 4 with the Omarchy shell, git, Python 3, and GNU timeout. Everything
else is optional and degrades on its own terms: without Docker the Containers
section explains itself, without ss there are no services, without
~/.ssh/config there are no machines, and without lazygit or lazydocker those
actions simply do not appear.
License
MIT