
Screen Time
Daily screen time for the Omarchy bar, drawn as a GitHub-style grid of daily boxes. Digital Wellbeing / Apple Screen Time, in your top bar, entirely local.
The bar shows today's total next to a strip of the last seven days. Clicking it opens a panel with the per-app breakdown, six months of daily boxes, and the last seven days as bars.
Preview
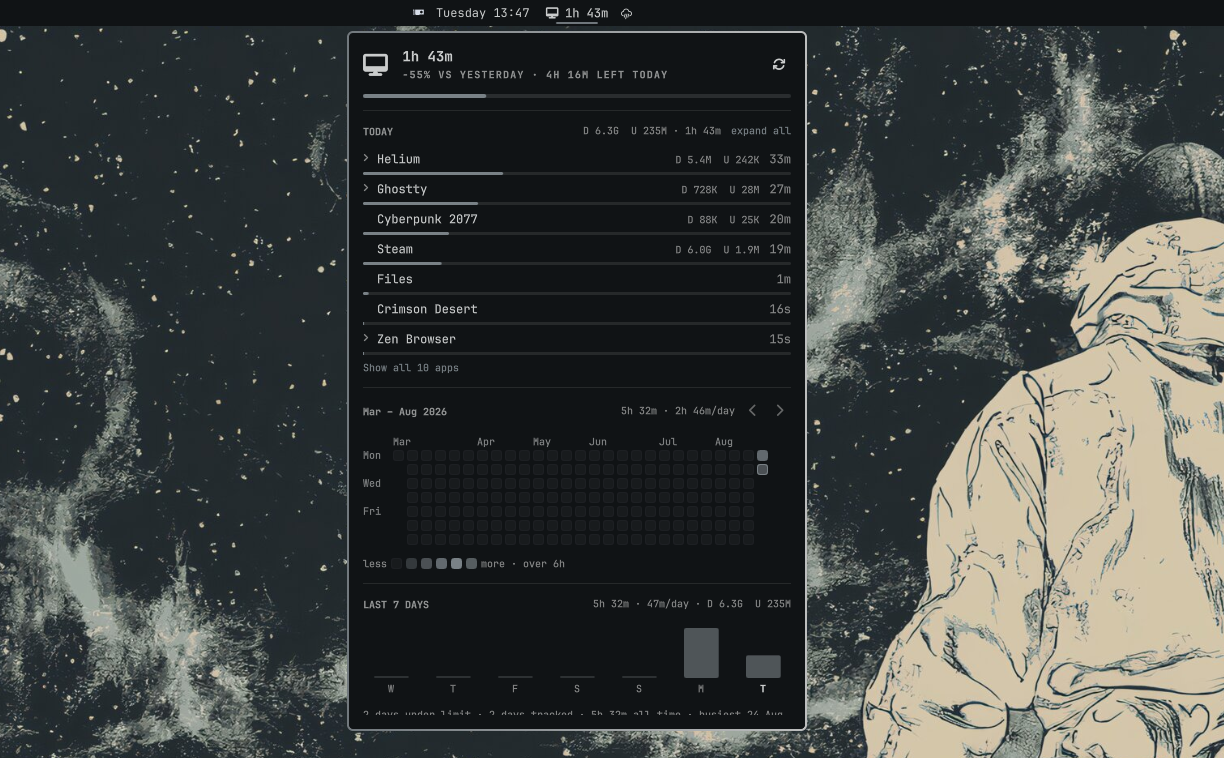
 Screen Time                        1 day under limit   ⟳
 16m
 5H 43M LEFT TODAY
 ────────────────────────────────────────────────────────
 TODAY                            D 1.2G  U 45M · 16m
 Cyberpunk 2077                   D 890M  U 12M    13m
 Ghostty                          D 4.2M  U 1.1M   13m
 Helium                           D 310M  U 32M     2m
 Spotify                          D 8.4M  U 210K   21s

 Mar – Aug 2026                     16m · 16m/day   ‹  ›
       Mar        Apr      May      Jun      Jul     Aug
 Mon  ▫▫▫▫▫▫▫▫▫▫▫▫▫▫▫▫▫▫▫▫▫▫▫▫▫▫▫▫▫▫▫▫▫▫▫▫▫▫▫▫▫▫▫▫▫▫▫▪
 Wed  ▫▫▫▫▫▫▫▫▫▫▫▫▫▫▫▫▫▫▫▫▫▫▫▫▫▫▫▫▫▫▫▫▫▫▫▫▫▫▫▫▫▫▫▫▫▫▫
 Fri  ▫▫▫▫▫▫▫▫▫▫▫▫▫▫▫▫▫▫▫▫▫▫▫▫▫▫▫▫▫▫▫▫▫▫▫▫▫▫▫▫▫▫▫▫▫▫▫
 less ▫▪▪▪▪▪ more · over 6h
Why another screen time plugin
Two others exist (agx.screen-time, omasot) and both are good. This one is
built around a different picture: a contribution grid, one box per day, the
thing you already read at a glance on a GitHub profile. Boxes are shaded
against a daily limit you set, and a day that went over it turns your theme's
urgent colour instead of getting "greener". More is not better here.
Features
| Daily boxes | Six months of days as a GitHub-style grid. Cells resize to fit the panel, so the newest day is never clipped. |
| Shaded against a limit | Intensity is a share of your daily limit, and over-limit days go urgent-red. Optional traffic palette ramps green → amber → red. |
| Click any day | Opens that day's per-app breakdown. Click again, or press t, to go back to today. |
| Per-app breakdown | Today's apps with share bars, resolved to real names from .desktop entries (com.mitchellh.ghostty → Ghostty). |
| Games by name | Steam reports a window as steam_app_1091500; the game names itself in its own manifest, so the row reads Cyberpunk 2077. |
| Data per app | Every row carries what that app downloaded and uploaded — D 890M U 12M — with day, week and all-time totals. No root, no kernel module. |
| What you were actually doing | A terminal reports the program running in it, not the terminal: opencode 20m, claude 14m, nvim 8m, or the working directory when a shell is idle. Browsers report the site: YouTube 1h 30m. |
| Openable folders | The breakdown is a tree. Each app is a folder you click open to see what ran inside it — Ghostty → grok, kiro-cli, workflows. Unresolved time inside a folder shows as other, so the children always add up to the parent. |
| Limit tracking | A progress bar toward the limit, time left, and a streak of consecutive days under it. |
| Last 7 days | Clickable bars, today emphasised, zero days shown as a faint rule rather than a stub. |
| Idle-aware | The clock stops after idleTimeoutSec with no input, and when no window has focus. A bare desktop is not usage. |
| Video still counts | Idle inhibitors are respected, so a two-hour film with no keypresses is still two hours of screen time. |
| Screensaver never counts | The screensaver holds an idle inhibitor while it runs, so it is excluded by app id, along with lock screens. |
| Suspend-safe | A sample that arrives far later than its interval is treated as a gap and dropped, not billed as hours. A backwards clock step is dropped too. |
| Midnight-safe | A session running through midnight splits across both days by wall clock, not by whenever the next commit happens. |
| Bar modes | Right-click cycles boxes + time → time only → icon only. Remembered on the widget entry. |
| Terminal CLI | screentime today, week, year render in the terminal, including an ASCII heatmap. |
| Local only | One JSON file. No network, no telemetry, no accounts. |
Install
omarchy plugin add https://github.com/srineshr1/omarchy-screentime.git
omarchy plugin enable io.github.ricky.screentime
Needs Omarchy Quattro (the Quickshell shell) and python3, which Omarchy
already ships. A Nerd Font provides the glyph.
Using it
| Action | What happens |
|---|---|
| Left click | Open / close the panel |
| Middle click | Commit buffered time and refresh now |
| Right click | Cycle the bar display mode |
| Click a box | Show that day's per-app breakdown |
t |
Back to today |
a |
Expand / collapse the full app list |
g |
Open / close every app folder |
[ ] |
Move the window one month back / forward |
r |
Refresh |
Esc |
Close |
Summon it from a keybind:
omarchy-shell io.github.ricky.screentime toggle
Settings
Configurable from Setup > Plugins, or inline on the widget's entry in
~/.config/omarchy/shell.json.
| Key | Default | What it does |
|---|---|---|
dailyGoalHours |
6 |
Your daily limit. Box shading and the over-limit colour scale against it. |
historyMonths |
6 |
Months of daily boxes in the panel. Fewer months means bigger boxes. |
idleTimeoutSec |
120 |
No input for this long stops the clock. |
barMode |
strip |
strip (boxes + time), total (time only), icon (glyph only). |
gridPalette |
accent |
accent for GitHub's single hue, traffic for green → amber → red. |
detailLevel |
full |
off for app names only, terminal to also record what runs in terminals, full to also record which site a browser is on. |
weekStartsMonday |
true |
Set false for Sunday-first rows, like GitHub. |
ignoredApps |
"" |
Extra app ids never to count, comma-separated. A trailing * matches a prefix (steam_app_*). Screensaver and lock screens are always ignored. |
detailRetentionDays |
120 |
How long per-app detail is kept. Daily totals are kept forever. |
trackNetwork |
true |
Record how much each app downloaded and uploaded. Set false to stop sampling the socket table entirely. |
How time is counted
The service watches the compositor's focused toplevel and accrues seconds against that app. Elapsed time is credited to the app that held focus during the interval, not whatever is focused when the timer fires, so switching windows attributes cleanly.
Nothing accrues while the seat is idle, while no window has focus, or while the focused surface is a screensaver or lock screen.
Seconds accumulate in memory and are handed to bin/screentime commit every
60 seconds, on wake from idle, at midnight, and on shutdown. That helper is the
only writer of history.json and it writes atomically via a temp file and
rename, so a crash costs at most one 60-second batch and can never leave a
torn store. The network sampler writes only its own small state file, and both
take the same lock, so two overlapping runs cannot lose each other's numbers.
Known limit: idle is detected by timeout, so up to idleTimeoutSec of the
period after you walk away is still counted. Lower it if that bothers you.
What you were actually doing
"Ghostty 4h" is not a useful sentence. bin/resolve-focus turns the focused
window into the thing you care about, using the window title first:
| Title | Row |
|---|---|
opencode |
opencode |
Refactor the tracker - claude |
claude |
~/Projects/Screentime |
Screentime |
…/temp/ComfyUI/workflows |
workflows |
Never Gonna Give You Up - YouTube - Helium |
YouTube |
*Unsaved Workflow - ComfyUI - Helium |
ComfyUI |
Terminals put the running program or the working directory in their title, and browsers put the page title there. The title is the primary signal because it is the only one that survives a terminal that keeps every window in one process: Ghostty runs all of its windows under a single pid, so walking that pid's children cannot tell one window from another.
When a terminal's title is uninformative — a bare foot, or Omarchy's floating
terminal calling itself Omarchy — the resolver falls back to the process tree,
picking the foreground process group under the window's pid. If several windows
share that pid and disagree, it reports nothing rather than guessing.
Two things it deliberately does not do:
- The page title never reaches disk. Only the trailing site segment is kept,
so
how to treat a rash - Google Searchis stored asGoogle Searchand a video is stored asYouTube. What you searched for or watched is dropped. - Unrecognised pages get no label. A page with no site segment is counted as plain browser time instead of creating one row per page, which would both bloat the store and record what you were reading.
Set detailLevel to terminal to keep terminal detail but stop looking at
browser titles, or off to record nothing but app names.
Detail is stored as appId/detail, so the daily totals the heatmap draws are
unchanged by it, and g in the panel rolls detail back up into per-app totals.
Games by name
Hyprland reports a Steam game's window as steam_app_1091500, and that is the
id the store keeps, since it is stable and Steam's own. For display, the id is
looked up in the game's appmanifest_1091500.acf — the file Steam already keeps
next to the install — so the row reads Cyberpunk 2077. Every library listed
in libraryfolders.vdf is searched, including a second drive and Flatpak's
Steam, and an uninstalled game falls back to Steam app 1091500 rather than
losing its hours. Nothing is fetched from the network.
Data per app
Each row also shows what that app moved: D 890M U 12M. Day, week and all-time
totals sit in the panel's header lines, and screentime net prints the same
breakdown in a terminal.
It works without root and without a kernel module. ss -tinep reports every TCP
socket you own along with the pid holding it and that socket's lifetime byte
counters. The plugin samples that every 15 seconds, diffs each socket against
its previous reading, and walks the owning pid up the process tree until it hits
a process that owns a window — so a browser's network process, a game's helper
and Steam's web helper all land on the app you would name them by, keyed exactly
like screen time. A socket with no window above it is filed under its own
process name, which is what you want to read for a daemon or a CLI download.
Sockets belonging to another user — the system resolver, a VPN daemon — do not
expose a pid to you, so their bytes go in one System row rather than being
dropped.
The kernel keeps byte counters on TCP sockets and not on UDP ones, so a browser
talking QUIC / HTTP3 is invisible to the socket table — and a browser is exactly
what moves the most data. Rather than let that traffic vanish, each sample is
reconciled against the interface counters in /proc/net/dev, and whatever the
wire moved that no socket accounted for lands in one Other traffic row. So
the day total is what your ISP would agree with, Steam 2.4 GB is exact, and an
hour of YouTube shows up as Other traffic instead of as nothing at all.
Only real devices are summed: a NIC has a device link under /sys/class/net
and a tunnel or a container's veth pair does not. That is not tidiness — a VPN's
bytes are also counted on the interface carrying them, so adding both would
double every one of them.
Three things to know about the numbers:
- Other traffic is not only QUIC. Packet headers are in there too, which is why it is never exactly zero even on a machine with no HTTP/3 at all.
- QUIC cannot be attributed to an app. Nothing short of root can say which process moved a UDP byte, and guessing would put invented figures in a report people use to check a data cap.
- The tail of a connection is lost from its app. Bytes moved after the last sample that saw a TCP socket go with it when it closes; the interface counters still see them, so they resurface under Other traffic rather than going missing.
Set trackNetwork to false to stop sampling the socket table at all.
Sampling runs whether or not the seat is idle: a download finishing while the screen is locked is still data you used, even though it is not screen time. Bytes buffer in a small side file and are folded into the store by the same 60-second commit that banks screen time, so the store is not rewritten on the sampling cadence.
Reading from helpers
The shell runs for the whole session, so anything it reads from a helper has to
be bounded as it arrives, not after. Quickshell's StdioCollector cannot do
that: it appends every chunk into one buffer and only hands the result to QML
once the stream ends, so a ceiling applied to the finished text bounds what is
kept rather than what was taken. A helper that ran away would already have
been allocated inside the shell by the time any QML code could object.
BoundedReader.qml reads through SplitParser with an empty split marker
instead, which emits each chunk as it arrives and retains nothing of its own. It
counts as it goes, stops retaining at the ceiling, and terminates the producer —
escalating to SIGKILL if the producer writes more after being asked to stop.
What remains is one chunk in flight, a transient the size of a pipe read rather
than an accumulation the size of the output.
| Stream | Ceiling | On overflow |
|---|---|---|
snapshot / commit stdout |
4 MB | Stop the helper, report the error |
resolver / netsample stdout |
64 KB | Stop the helper, drop the reply |
snapshot / commit stderr |
4 KB | Cap it, keep reading |
resolver / netsample stderr |
nothing kept | Drain it, keep reading |
stderr is capped but never fatal. The ceiling is what bounds the allocation, and
killing a helper over noise on stderr would cost a committed batch for nothing.
Nor is it left unread: an unread pipe fills up and blocks the helper mid-write
instead of letting it exit. Killing a helper cannot lose data in any case —
commit writes the store atomically, under a lock, before it prints anything.
The helper side is bounded the same way, before any parse: a Hyprland control
socket reply stops at 8 MB and is refused whole rather than parsed truncated,
and one ss dump stops at 4 MB or five seconds, whichever comes first.
Data
One file:
$XDG_DATA_HOME/omarchy-screentime/history.json
{
  "version": 1,
  "days": {
    "2026-08-24": {
      "total": 16200,
      "apps": {
        "com.mitchellh.ghostty/opencode": 7200,
        "com.mitchellh.ghostty/claude": 1800,
        "helium/YouTube": 5400,
        "org.gnome.Nautilus": 1800
      },
      "net": {
        "helium": [312000000, 32100000],
        "steam_app_1091500": [890000000, 12400000]
      },
      "netTotal": [1202000000, 44500000]
    }
  }
}
Integers. A key in apps is appId or appId/detail, split on the first
slash, and the value is seconds. A key in net is always a plain appId, and
the value is [down, up] in bytes — which tab downloaded what is not something
the socket table can answer. total and netTotal are authoritative and
survive pruning, so a day whose per-app detail has aged out still reports what
it added up to. screentime path prints the location; delete the file to reset
everything.
A second file, netstate.json, holds the previous reading of each open socket
plus the bytes not yet folded into the store. It is scratch space: deleting it
loses at most the last minute of data.
Not under $XDG_DATA_HOME/omarchy/ on purpose: on a real install that is a
symlink to the root-owned /usr/share/omarchy.
CLI
The same engine the widget uses, from a terminal:
screentime today          # today's total and per-app breakdown
screentime --group today   # the same, rolled up per app
screentime week           # last 7 days as bars
screentime year [YYYY]    # ASCII contribution heatmap
screentime net            # per-app data usage, down and up
screentime json           # raw store
screentime prune          # drop aged per-app detail
screentime path           # where the store lives
Live state over IPC:
omarchy-shell screentime status   # JSON: current app, counting, pending, window
omarchy-shell screentime today    # "4h 30m"
omarchy-shell screentime net      # "D 1.2 GB · U 45 MB"
omarchy-shell screentime flush    # commit buffered time now
Development
node --test "tests/*.test.mjs"          # pure JS logic (Model.js, Tracker.js, Stream.js)
python3 -m unittest discover -s tests   # the data engine, and the QML read boundary
omarchy plugin validate .               # same checks the shell runs at load
lib/Tracker.js holds the accrual rules as pure functions — idle handling,
suspend gaps, midnight splits, ignore rules — so what counts as screen time is
testable without a compositor. lib/Model.js is presentation-only, and
lib/Stream.js is the per-chunk ceiling arithmetic behind BoundedReader.qml.
All three are QML JS modules loaded under plain node by the test harness.
tests/test_qml_reader.py is the exception to that: whether the shell allocates
a helper's whole output before QML can refuse it is not visible to any pure
function, so those cases run a real headless Quickshell against a real producer
and measure peak RSS from outside. They skip when Quickshell is not installed.
Note that saving a file only hot-reloads when the plugin directory is a real
directory under ~/.config/omarchy/plugins/. If you symlink a working copy in,
restart the shell to pick up changes:
omarchy-restart-shell
License
MIT