
Omatop
An Omarchy bar widget that shows CPU and memory usage side by side and, in its popup, which processes are actually eating them.
- CPU and memory in one widget — both readouts in the bar, both process lists in one popup
- Per-process breakdown — the top consumers per metric, aggregated by process name
- Docker-aware — processes inside containers show the container name underneath
- Smart process names — resolves unhelpful names like
MainThread, Nix wrappers, and generic interpreters to the real application
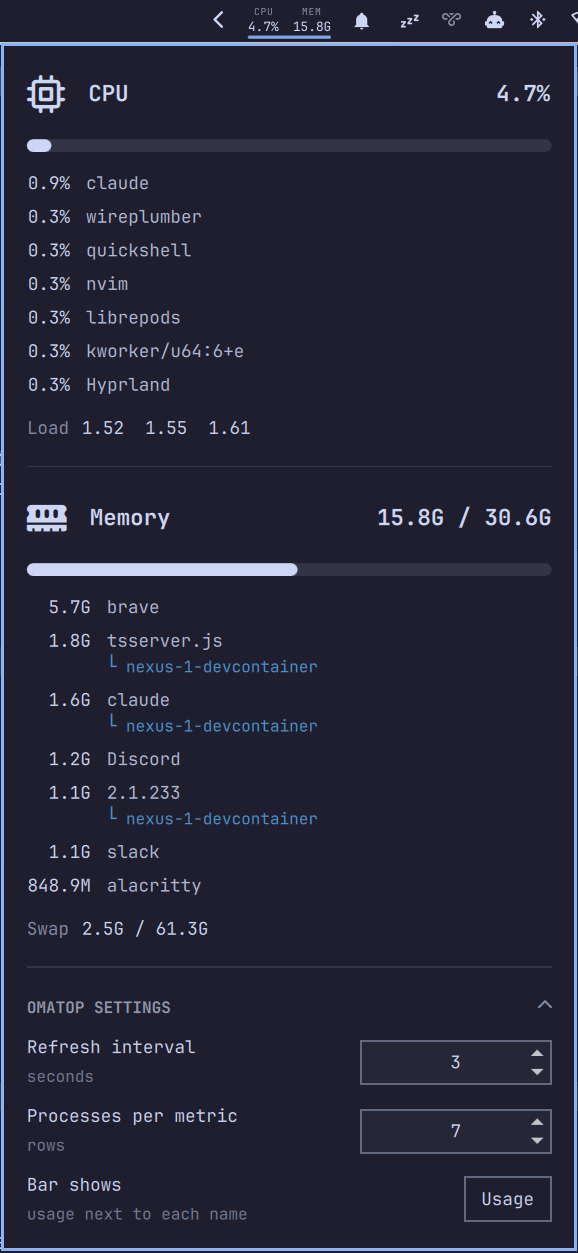
This is the Omarchy-shell port of waybar-top-cpu-mem.
Requirements
- Omarchy with
omarchy-shell(Quattro or newer) bash,nproc,top,ps, andfree— thecoreutilsandprocps-ngpackages an Omarchy install already has- A Nerd Font as the bar font, for the metric and chart glyphs (Omarchy's default)
- Optional:
docker— container names appear only when the Docker CLI is present; without it that step is skipped
Omatop needs no elevated privileges: it reads /proc, ps, and (when present)
docker ps as your own user.
Install
omarchy plugin add https://github.com/twiking/omarchy-omatop.git
omarchy plugin enable io.github.twiking.omatop
The widget lands in the bar's right section; move it with omarchy bar move.
Update
omarchy plugin update io.github.twiking.omatop
Remove
omarchy plugin disable io.github.twiking.omatop   # takes it off the bar
omarchy plugin remove io.github.twiking.omatop    # deletes the plugin checkout
Removal deletes ~/.config/omarchy/plugins/io.github.twiking.omatop/. Omatop
writes nothing outside its own settings keys in the widget's bar.layout entry
in ~/.config/omarchy/shell.json; omarchy plugin disable drops that entry, and
no other file is touched.
Settings
The popup has a collapsed OMATOP SETTINGS section at the bottom — click the header to
expand it and change the refresh interval, the number of processes listed per
metric, or what the bar shows (Usage vs Icon only). Changes save
immediately.
With the values turned off the bar falls back to a single bar-chart glyph
(nf-md-chart_bar), so the widget stays visible and clickable.
There is no config file of Omatop's own: bar widgets are configured inline in
their bar.layout entry in ~/.config/omarchy/shell.json, which the shell owns,
so the panel writes through the shell's updateEntryInline the same way the
first-party widgets do. Editing that entry by hand works just as well:
| Key | Type | Default | What it does |
|---|---|---|---|
processCount |
integer 1–20 | 7 |
How many processes the popup lists per metric |
refreshIntervalSec |
integer 1–60 | 3 |
How often stats are sampled |
showValues |
boolean | true |
Show the CPU / MEM readouts; off shows the bar-chart icon instead |
{
  "bar": {
    "layout": {
      "right": [
        { "id": "io.github.twiking.omatop", "processCount": 7 }
      ]
    }
  }
}
The bar readout
Each metric is a two-line caption: its name in small type (CPU, MEM) with
the current value under it, the two lines centered on each other and sized to fit
the bar's height. Vertical bars have no room for text, so they show the bar-chart
glyph instead and leave the numbers to the popup.
Interactions
- Left click — open/close the popup
- Right click — launch or focus
btop - Esc — close the popup
How it works
bin/omatop-stats <cpu|memory> [count] collects one metric in a single shot and
prints line-based TSV; Panel.qml runs it once per metric on a timer and
Model.js parses the output. Running the script by hand is the fastest way to
debug a wrong-looking number.
CPU
CPU usage is normalized across all cores to a 0–100% scale (matching tools like
btop). top in batch mode measures percentages and ps resolves process names;
the two are joined by PID.
Memory
Memory is aggregated per process name using RSS from ps, so multiple instances
of the same program (browser tabs, workers) are summed into one row. The bar
label shows used memory in GB, the panel adds total RAM after it, and the usage
bar shows the percentage of that total.
Process name resolution
Both metrics handle cases where the reported process name is unhelpful:
MainThread(Python apps) — resolved from the command line.foo-wrapped/.foo-wrap(Nix wrappers) — resolved to the actual binary name- Generic interpreters (
node,python,bash, etc.) are skipped in favor of the actual script or app name
Docker detection
Processes running inside Docker containers are detected via cgroup membership
(/sys/fs/cgroup/system.slice/docker-*.scope) and matched against
docker ps. The container name is shown below the process row.
Docker is entirely optional. With no docker binary the lookup is skipped; if
the binary is there but the daemon refuses the connection, the error is ignored;
and if the daemon hangs, the call gives up after two seconds. In every case the
readout is the same minus container names.
Development
omarchy plugin validate "$HOME/.config/omarchy/plugins/io.github.twiking.omatop"
qmllint -I "$OMARCHY_PATH/shell" Panel.qml
License
MIT — see LICENSE.