
Nexthop
Is it your Wi-Fi, or your ISP? Know before you reboot anything.
Nexthop sits in your Omarchy bar and watches both halves of your connection — this machine to the router, and the router to the internet. When things feel slow, one glance tells you which side of the router owns the problem.
Why you'd want it
- An answer, not a graph. One 0–100 score in the bar, colour-coded. Green means stop worrying. When it drops, the panel says why — in the words you'd use to a person: responsiveness, reliability, speed.
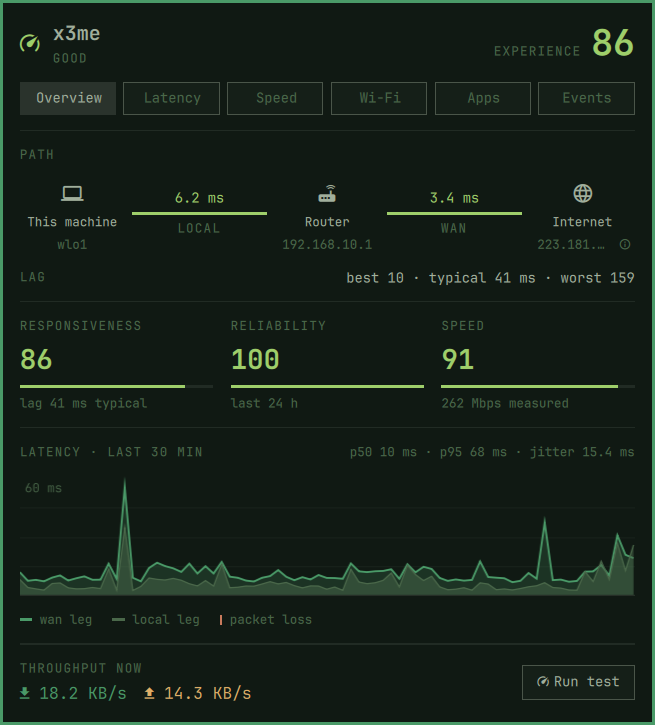
- "Is it me or is it them", settled. The Overview draws your laptop, your router and the internet with a live latency number on each leg. The slow leg is the guilty one.
- Proof your ISP can't wave away. Every outage is logged with its start, duration and which side failed. Copy report produces the plain-text summary a support desk actually asks for.
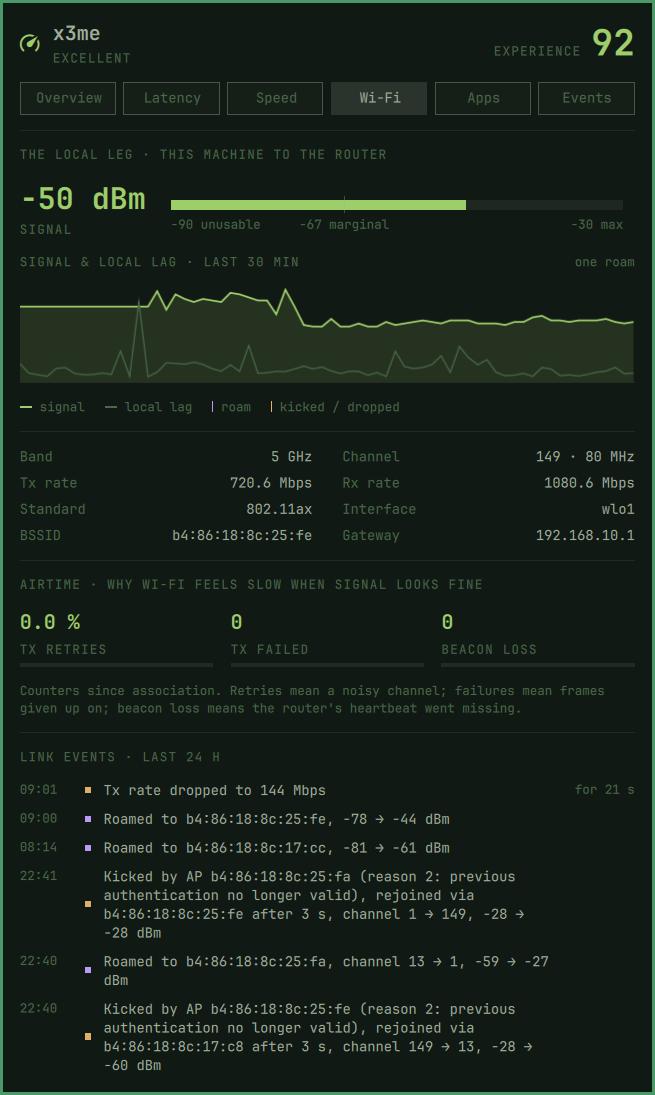
- It sees what you can't. A router silently kicking your laptop off Wi-Fi, an access point renegotiating to a crawl, the 3 a.m. outage that was over before breakfast — all in the log, with timestamps and durations.
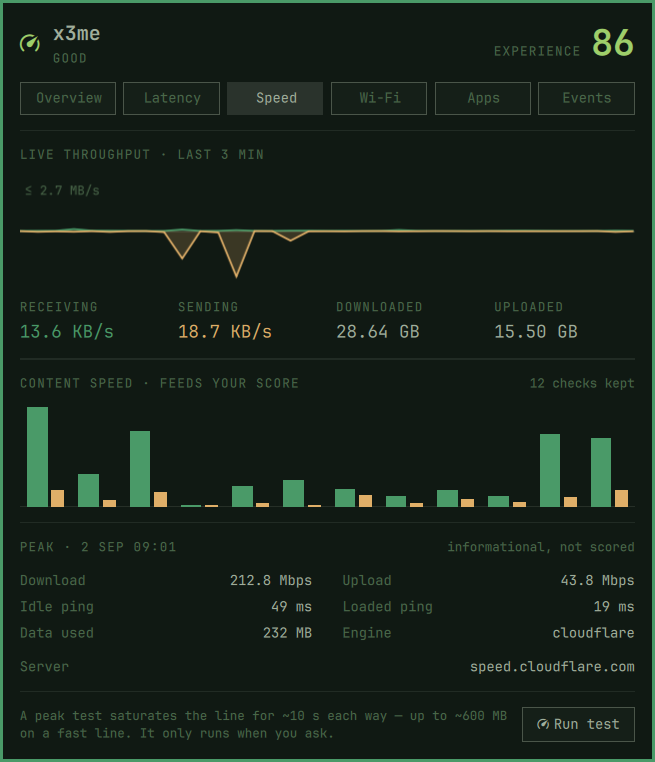
- Speed answers without speed tests. Small hourly checks keep the speed score honest; the big saturating test runs only when you ask.
It won't get in your way
- No root, ever. No sudo, no capabilities, no packet capture. It runs as your user and reads what any process may read.
- You won't feel it. About 3 % of one CPU core and ~30 MB of memory — no fan, no stutter, nothing competing with your work.
- It doesn't clog your line. The probes are pings and payload-free handshakes and add up to a few MB an hour; the hourly speed check is up to about 40 MB on a fast line and a fraction of that on a slower one, and can be turned off. Nothing saturates your connection unless you press the button.
- Private by construction. Everything it measures stays on your machine — no account, no cloud, no telemetry. Even your own IP is shown masked, so a screenshot of the panel is safe to post. The one thing it asks the outside world is whether a newer version exists: once a day it asks the repository you installed from, sends nothing about you, and shows a small marker if so. Turn that off in the panel's Setup tab (the cog) and it asks nothing.
Made for Omarchy
Nexthop is not a ported app — it is built for this desktop. It follows your theme automatically, uses the shell's own type and spacing, and opens instantly from the bar like every other panel. It is MIT-licensed, built in the open, and shaped by community feedback — the masked WAN address on the Overview came from a reader's suggestion the day after launch.
Install
omarchy plugin add https://github.com/x3me/omarchy-nexthop.git --enable
Requirements: python3, ping, curl, ss, ip and git (all present on
a stock Omarchy; git only serves the daily update check), iw for Wi-Fi
detail, wl-copy for Copy report, optionally nmcli for the metered flag
and speedtest (Ookla) for peak tests.
| Latency, by leg | Speed |
|---|---|
 |
 |
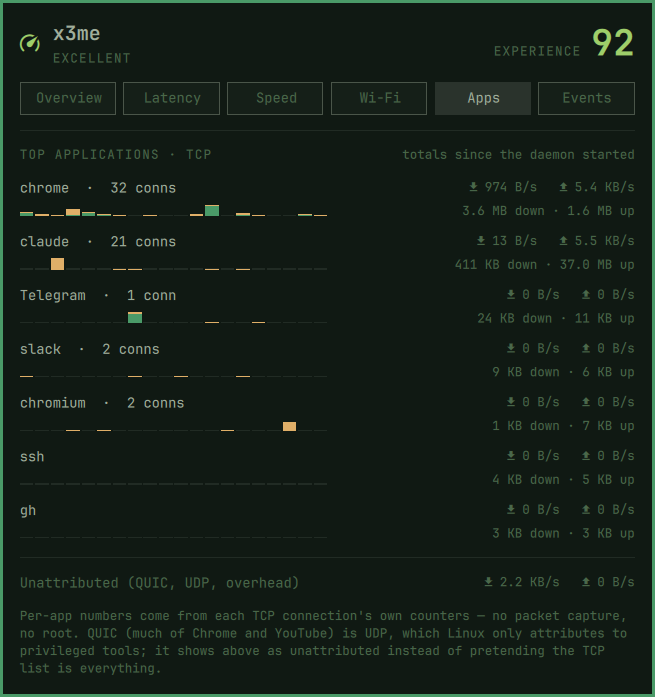
| Wi-Fi | Applications |
|---|---|
 |
 |
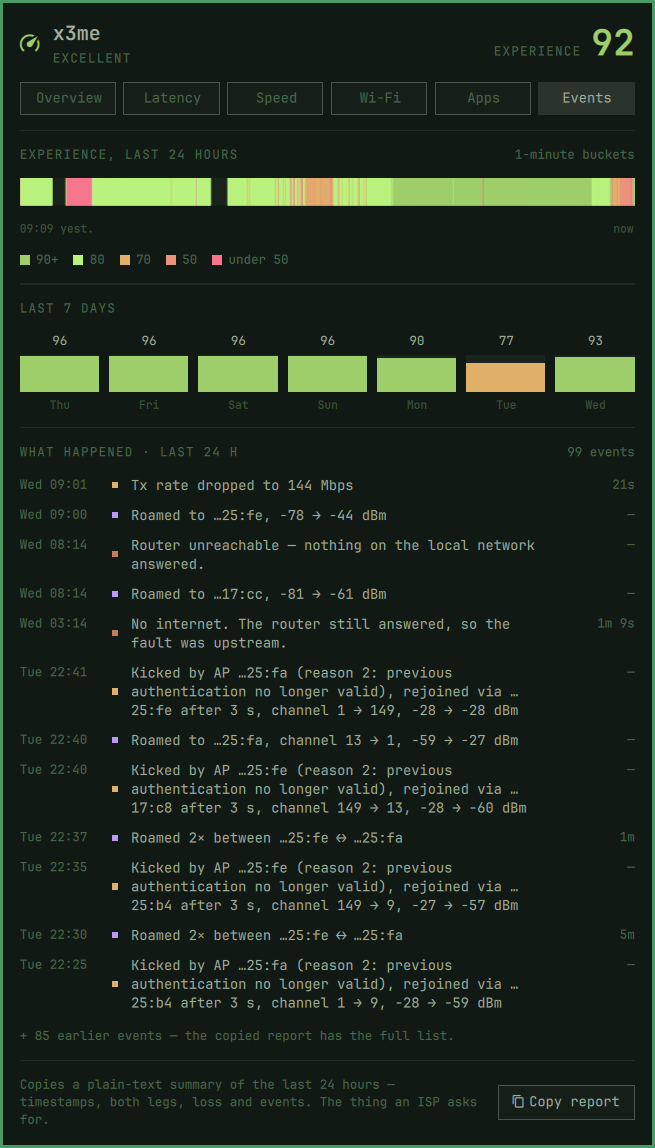
The event log, naming who did what — including the router that kicks:
Updating
Nexthop never updates itself, and Omarchy does not tell you when a plugin has a newer version, so an install stays exactly where it was until you run:
omarchy plugin update io.github.x3me.nexthop
It shows you what changed before applying it. Worth running if you installed before 10 September 2026: the panel that would not close on Omarchy 4.0.3 was fixed in 0.2.27, and a Reliability score stuck at 0 after the daemon stopped mid-outage in 0.2.21. Issues have been filed here for both, from versions that predated the fix. To see yours:
grep '"version"' ~/.config/omarchy/plugins/io.github.x3me.nexthop/manifest.json
From 0.2.3 on, Nexthop also checks once a day whether a newer version is published and puts a small mark beside the verdict in the panel header; it never installs anything itself.
If the update refuses to apply, you probably edited a file in the plugin
yourself — most likely Panel.qml, to work around the Omarchy 4.0.3 bug
that left the panel stuck open. That fix has been in Nexthop since 0.2.27,
so the local edit can go:
git -C ~/.config/omarchy/plugins/io.github.x3me.nexthop status --short   # see what you changed
git -C ~/.config/omarchy/plugins/io.github.x3me.nexthop checkout -- Panel.qml
omarchy plugin update io.github.x3me.nexthop
Using it
- Bar widget: the index, the lag figure, or just the icon
(
displayModeon the widget's entry in~/.config/omarchy/shell.json). Colour is the verdict; during an outage it shows how long you've been down. Click opens the panel, middle-click runs a peak test. - Panel tabs: Overview (is it me or is it them), Latency (window picker, per-leg stats, latency under load), Speed (content history + last peak), Wi-Fi (the local leg in detail, airtime, link events), Apps (who is using the connection), Events (what happened + Copy report), and a Setup cog with the four settings worth reaching from the panel. Arrow keys or 1–6 switch tabs.
- CLI:
bin/nexthop live | query --window 24h | events | tests | report | peak— all JSON exceptreport. - IPC:
omarchy-shell io.github.x3me.nexthop toggle | speedTest | showTab Latency
Name your access points
Put a CSV inventory at
~/.config/nexthop/bssid_to_ap_inventory.csv. The required columns are
bssid and ap_name; extra columns such as band, channel, and SSID are fine:
bssid,ap_name,band,channel,ssid
02:00:00:00:00:01,Hallway AP,6 GHz,37,TestNet
Known names appear on the Overview and Wi-Fi tabs and are applied to link history when it is displayed. Event history stores the raw BSSID, so changing an inventory name also updates how earlier events are shown. The file is noticed automatically when it changes; unknown BSSIDs continue to use their address.
What it measures
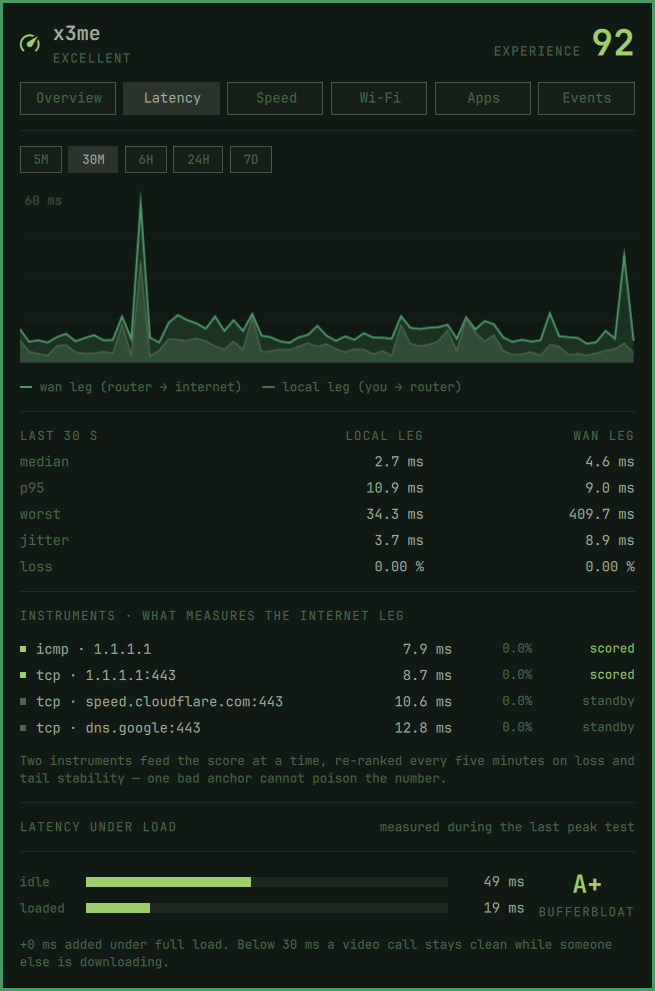
- Two-leg latency, twice a second. One persistent probe to your gateway, others to the internet. The difference between the legs is your ISP; the gateway leg is your Wi-Fi.
- Lag — one number for how the connection feels, folding latency, jitter (RFC 3550 IPDV) and packet loss, reported as best / typical / worst.
- An experience index (0–100) from three components — the weakest sets
the number and the other two nudge it, so one broken dimension cannot
hide behind two good ones:
- Responsiveness — scored from lag
- Reliability — uptime, charged in time: outages in full, brief self-healed interruptions at half
- Speed — scored from small periodic content checks (up to ~40 MB on a fast line, ~5 MB on a slow one, hourly by default), not from saturating speed tests. A check waits until this machine has left the line quiet for 30 s (and skips the hour after 30 min of waiting), and never runs in the first two minutes after a wake. Only checks from the last 3 h, on the Wi-Fi band in use now, count; with none, Speed is left out of the index rather than carried over. No configuration: the score answers "is it fast enough" on an experience-anchored curve (diminishing returns past ~100 Mbps), minus a penalty when the line drops well below its own recent p90 — so shared-office variance stays quiet while genuine degradation shows. Setting a plan in the widget settings switches to plan-accountability scoring instead
- Peak speed tests, on demand only. Prefers the official Ookla
speedtestCLI when installed; falls back to Cloudflare, then fast.com — both need nothing beyondcurl. Loaded latency (bufferbloat) is captured during every run by the probes that were already watching. - Wi-Fi health: signal against a labelled scale, band/channel/rates, and the airtime counters (retries, failures, beacon loss) that explain why Wi-Fi feels slow when the signal bar looks full.
- Link events: every change of access point says who ended the previous association — a roam (this machine chose to move), a kick (the access point deauthenticated us, with its 802.11 reason code) or a drop (the link fell over) — plus channel and signal deltas, associations, and sustained Wi-Fi rate drops, logged with durations.
- WAN address: the IP this connection appears from, on the Overview
path — masked (
103.87.…) with tap-to-reveal, because panel screenshots end up on forums. Asked ofspeed.cloudflare.com, a host the daemon already talks to; shown live, never written to history. - Per-application traffic — top apps by TCP connection counters
(
ss -tinp, no root, no packet capture), each with a one-minute history strip and session totals. What Linux won't attribute without privileges (QUIC/UDP, overhead) is shown as its own bucket rather than hidden. - Outage detection with a notification once an outage has lasted a few seconds and one when it clears — naming the leg that failed. Brief self-healed interruptions are logged, never notified. A wan outage needs the probes to agree: if TCP handshakes keep succeeding while pings go unanswered, the log records an "ICMP went quiet" event instead — no alarm for downtime you are not having.
- VPNs, drawn as VPNs. When the probes' routes leave through a tunnel (WireGuard, a Tailscale exit node, OpenVPN, a PPP VPN), the path gains a fourth stop — this machine, router, VPN, internet — the router leg keeps measuring your real router underneath, and everything past it is labelled the tunnel's. Its latency is judged against the tunnel's own usual level rather than colouring a VPN's extra 100–200 ms red. An outage through a tunnel still counts against Reliability — it is the connection you have — but nothing names your ISP for it, not the header, the notification, the event log or the copied report. Speed checks through a tunnel run, are labelled via VPN, and are only compared with other checks through the same tunnel. Detection reads which kind of link each route uses from the kernel, not what the interface is called, so a connected VPN that carries none of the probes (Tailscale without an exit node) is not one, and a line that is itself a tunnel — PPPoE, or the CLAT an IPv6-only network uses for IPv4 — is recognised as the line: a VPN that takes over the default route still keeps its own server reachable outside the tunnel, and that route is what tells the two apart. A tunnel that routes nothing differently (policy-only IPsec) cannot be seen this way.
- History: per-minute for 7 days (configurable), hourly for a year, every test and event kept. A month of monitoring stays under ~12 MB.
- Copy report — a plain-text summary of the window you are looking at, with timestamps, both legs and loss. The thing an ISP actually asks for — so time measured through a VPN is listed as such and kept out of the ISP leg's figures.
How it works
The QML plugin is a thin reader. All measurement lives in nexthopd, a Python 3 daemon (standard library only, no pip), spawned and supervised by the plugin's shell service. Five files are the whole contract — four the daemon writes, one the panel writes for it:
| file | cadence | consumer |
|---|---|---|
$XDG_RUNTIME_DIR/nexthop/live.json |
2× per second | the bar widget |
$XDG_RUNTIME_DIR/nexthop/recent.json |
every 5 s | the panel's 30-min graphs |
$XDG_RUNTIME_DIR/nexthop/apps.json |
every 3 s | the Apps tab |
~/.local/state/nexthop/history.db |
1-min rows | nexthop query, longer windows |
~/.local/state/nexthop/config.json |
when a setting changes | the daemon — derived, not edited: the panel rewrites it from your bar entry every time the shell starts, so changes made here are overwritten. Settings live in ~/.config/omarchy/shell.json |
The three snapshots are rewritten many times a minute between them and mean
nothing after a reboot, so they live in the session's runtime directory,
which is a tmpfs: they never touch the disk. History and settings stay
under ~/.local/state. The daemon never talks to the shell, so either side
restarts without the other noticing — and your history survives every
theme change.
To keep monitoring while the shell is down, install the optional
systemd unit (see the comments in nexthopd.service,
which also confines the daemon with the systemd sandboxing it can live inside);
the daemon holds a lock, so the shell service simply attaches.
What it talks to, and what that costs
The internet leg is measured by a small pool of instruments: ICMP and a
TCP handshake to the anchor you configure (1.1.1.1 by default), plus TCP
handshakes to 1.0.0.1 and dns.google — one probe target
outside Cloudflare, so a Cloudflare incident cannot silence the whole
pool. The two best instruments — fewest losses, steadiest tails,
re-ranked every five minutes with flap damping — feed the score; the rest
idle at a tenth of the rate. One anchor having a bad day stops being your
connection's bad day. Beyond the pool, the only other contacts are the
speed-test hosts named at the end and the once-a-day update check against
the repository you installed from.
| Probe | Where | Cost |
|---|---|---|
| ICMP | your gateway, and the anchor while seated | ~30 MB/day per target on the wire at the default 500 ms — two 84-byte packets a second; the gateway's share never leaves your LAN |
| TCP handshakes | the instrument pool, port 443, ~1/s while seated | ~20 MB/day per seated instrument — connections opened and closed, no payload |
| Reachability check | speed.cloudflare.com/cdn-cgi/trace | one ~1 KB HTTPS request when the network changes and hourly after that; every 30 s only while a sign-in page is suspected. Proves the real internet answered, and supplies the WAN address |
| Content check | speed.cloudflare.com | sized to hold ~1.5 s of transfer — up to ~40 MB on a fast line, ~5 MB on a slow one; hourly, and can be turned off |
| Peak test | Ookla / Cloudflare / fast.com | up to ~600 MB, only ever when you ask |
| Update check | the repository you installed from (git ls-remote) |
one request a day, carrying nothing about you; off in the Setup tab |
The TCP probes exist because ICMP is not what applications experience: routers commonly answer pings from hardware while real traffic waits in the queues that actually cause delay, and they rate-limit pings under load. Measuring both, against the same host, shows the difference rather than assuming it.
Peak tests size themselves to saturate the line for ~10 s each way — far less on a slow one — and run only from the panel, by middle-clicking the bar widget, or via IPC.
Privileges: none. No sudo, no capabilities, no packet capture. The
daemon runs as your user; everything it reads is world-readable (/sys
counters and link types, ping, iw, ss, ip route).
Remove
omarchy plugin remove io.github.x3me.nexthop
Measurement history stays in ~/.local/state/nexthop/; delete that
directory too if you want nothing left behind. If you installed the
optional systemd unit: systemctl --user disable --now nexthopd and
remove ~/.config/systemd/user/nexthopd.service.
Development
python3 -m unittest discover -s test    # fixtures recorded from real hardware
python3 -m nexthopd                     # run the daemon in the foreground
Design mockups live in design/ as the source artboards of the project's
design canvas.
License
MIT © Extreme Labs