
Everything Green for Omarchy
An Omarchy bar widget that answers one question: is everything green? It watches the CI/CD pipelines you pick and shows their latest status. GitHub Actions, GitLab CI, Argo CD, and Jenkins work out of the box. Anything else can be added as a drop-in provider plugin.
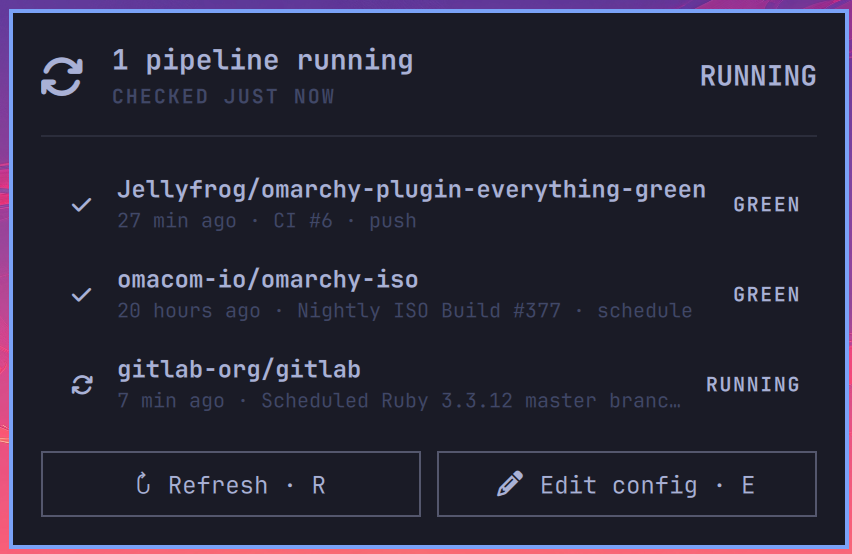
The bar shows one glyph for the whole verdict: when every pipeline passed, 2 when two of them are red. The panel lists each pipeline with its status, age, and latest run. Click a row to open it in your browser.
All the data comes from a small Python collector that calls plain HTTP APIs.
It uses only the standard library, and you do not need the gh, glab,
argocd, or Jenkins command-line tools.
Install
omarchy plugin add https://github.com/Jellyfrog/omarchy-plugin-everything-green --enable
The widget shows up in the right section of the bar. Next, tell it what to
watch: click the widget and press E (or click Edit config). Your editor
opens the sources file, which starts as a copy of
config.example.toml. It looks like this, shortened —
the real file has a commented example and notes for every provider:
# ~/.config/everything-green/config.toml

[[sources]]
provider = "github"
repo = "omacom-io/omarchy-pkgs"
workflow = "sync-aur.yml"   # a file name or a numeric id, not a display name
branch = "master"
label = "AUR sync"

[[sources]]
provider = "gitlab"
project = "gitlab-org/gitlab"
branch = "master"

[[sources]]
provider = "argocd"
server = "https://argocd.example.com"
app = "my-app"
token_env = "ARGOCD_TOKEN"

[[sources]]
provider = "jenkins"
base_url = "https://jenkins.example.com"
job = "folder/my-job"
username = "me"
token_env = "JENKINS_TOKEN"
Statuses update on the next check, which happens every 60 seconds by default. Middle-click the widget to check right away.
Refresh interval
refresh_interval_sec says how often a source is fetched again, in seconds.
The lowest value is 15 seconds and the highest is 1 hour. It can go in three
places, and the most specific one wins:
refresh_interval_sec = 60          # global: every source

[providers.github]
refresh_interval_sec = 120         # every GitHub source

[[sources]]
provider = "github"
repo = "omacom-io/omarchy-pkgs"
refresh_interval_sec = 300         # just this one
A source that is not due yet is read from the last saved result instead of being fetched again, so a repo that rarely changes costs no API calls. A source that failed is always tried again on the next check.
If your config sets any interval, it also decides how often the widget runs
the collector: the shortest interval across your sources becomes the check
rate. If you set no refresh_interval_sec anywhere, the widget's own
Refresh interval setting decides, and every source is fetched every time.
Providers
Every provider is a plugin: a small Python file in providers/.
It takes one HTTP API and turns its answer into the shared set of statuses
(success, failed, warning, running, pending, canceled, unknown).
| Provider | Watches | Source keys |
|---|---|---|
github |
latest workflow run of a repo | repo (required), branch, workflow (file name or numeric id), base_url (GitHub Enterprise), auth |
gitlab |
latest pipeline of a project | project (path or id, required), branch, base_url (self-hosted), auth |
argocd |
application health + sync | server, app (both required), insecure |
jenkins |
last build of a job | base_url, job (both required), username, insecure |
Each provider also answers to a few older names, so github-actions, gha,
gitlab-ci, argo, and argo-cd still work in configs you already have.
Every source costs exactly one request per tick. That is why workflow takes
a file name or a numeric id but not a display name like CodeQL: translating
a name means asking GitHub which id it has, on every tick, forever, to
re-learn something that never changes. Workflows with no file in the repo —
CodeQL's default code scanning setup, for one — can only be named by id:
gh api repos/OWNER/REPO/actions/workflows \
  --jq '.workflows[] | "\(.id)\t\(.name)\t\(.path)"'
Every provider also takes label (the name shown in the panel),
enabled = false, and the token keys below. When several sources of the same
provider share keys, put those keys in a [providers.<name>] table once
instead of repeating them.
Tokens
Public GitHub and GitLab pipelines need no setup. Private ones usually need
none either: when you are logged in to the gh or glab CLI, the provider
borrows that token for you (gh auth token / glab config get token). You
do not have to create a personal access token, and the credential stays
wherever the CLI keeps it. Argo CD and Jenkins always need a token of their
own.
To set up auth yourself, give a source (or a [providers.<name>] table)
one of these:
token_env  = "GITHUB_TOKEN"                    # read an environment variable
token_file = "~/.config/everything-green/gh.token"
token_cmd  = "secret-tool lookup ci github"    # any command that prints it
token      = "…"                               # inline, if you must
For each source, the token is looked for in this order: token, token_cmd,
token_file, token_env, the default environment variables
(GITHUB_TOKEN/GH_TOKEN, GITLAB_TOKEN,
ARGOCD_TOKEN/ARGOCD_AUTH_TOKEN, JENKINS_TOKEN/JENKINS_API_TOKEN), a
logged-in CLI (GitHub and GitLab only), and finally no token at all. Set
auth = "none" on a source to always go without one.
If you make a token by hand, this is what it needs to be allowed to do: GitHub Actions: read, GitLab read_api, Argo CD an account or role token that can get applications, and Jenkins a user API token. A token is only ever sent to the host you configured, and it never shows up in output or logs.
The collector uses ETags, so checking a pipeline that has not changed is
cheap. GitHub answers 304 Not Modified, which does not count against your
rate limit.
Controls
- Click the glyph in the bar to open or close the panel. Click a pipeline row to open it in your browser.
- Middle-click to check now.
- Right-click to jump to the first red pipeline. When nothing is red, this just opens the panel.
- Keys in the panel:
Rcheck now ·Eedit config ·OorEnteropen the first red pipeline ·Escclose.
Settings
Widget settings live on the widget's own entry in
~/.config/omarchy/shell.json. Change them with omarchy bar set:
omarchy bar set jellyfrog.everything-green refreshIntervalSec 30 --json
omarchy bar set jellyfrog.everything-green barStyle Counts
| Key | Default | What it does |
|---|---|---|
refreshIntervalSec |
60 |
How often the collector runs, from 15 seconds to 1 hour. Ignored when your config file sets refresh_interval_sec (see above). |
barStyle |
Auto |
Auto shows the verdict glyph, plus a count when something is red. Icon shows the glyph only. Counts shows a glyph and a count for each status. |
notifyOnFail |
On |
Off turns off the desktop notice when a pipeline starts failing, and the one when everything is green again. |
configPath |
"" |
Point another copy of the widget at a different config file, for example work and personal. You can run more than one copy. |
Add --json to send the value as a number or a boolean instead of a string.
When you leave a key out, it uses the default above.
Writing a provider
Put a Python file in ~/.config/everything-green/providers/. You do not need
to fork this repo. If your file has the same name as a bundled provider, yours
is used instead. This is the whole contract:
# ~/.config/everything-green/providers/nightly_deploys.py
"""My deploy dashboard."""

PROVIDER = "nightly-deploys"      # the name [[sources]] entries use
ALIASES = ("deploys",)            # optional

def fetch(source, ctx):
    data = ctx.get_json(
        source["base_url"] + "/api/latest",
        headers={"Authorization": f"Bearer {ctx.token(source, 'DEPLOY_TOKEN')}"},
    )
    return {
        "status": "success" if data["ok"] else "failed",
        "key": source["base_url"],          # stable identity for the row
        "label": data.get("name", "deploys"),
        "detail": data.get("summary", ""),
        "branch": data.get("ref", ""),
        "url": data.get("web_url", ""),
        "finished_at": ctx.iso_to_epoch(data.get("finished_at")),
    }
fetch(source, ctx) runs in a worker thread, once for each source you
configured. source is the merged config table for that entry. ctx gives
you:
get_json(url, headers=…, insecure=…)— caches with ETags and raises clean errorstoken(source, *default_env_vars)cli_token(argv)— a cached way to borrow a token from a local CLI, for example["gh", "auth", "token"]. It never raises.basic_auth(user, secret),quote(text),iso_to_epoch(text),timeoutctx.Fail("message")for errors the user should see
Return at least {"status": …}. Everything else is optional. Every string you
return is normalized to one line and capped before it reaches the panel, and a
url that is not http(s) yields a row that is simply not clickable — so
return what you have and let the collector worry about the shape.
providers/github.py is the reference version, with
comments all the way through.
You can check your work from a terminal at any time:
cd ~/.config/omarchy/plugins/jellyfrog.everything-green
python3 collect.py | jq            # the exact snapshot the widget renders
python3 collect.py --list-providers
Network and system access
The plugin runs no scripts when you install or remove it. While it runs, it:
- runs the bundled
collect.pywith the systempython3(standard library only) on the refresh interval; - sends HTTPS GET requests only to the API hosts named in your config;
- saves ETags, response bodies, and the last row for each source under
$XDG_RUNTIME_DIR/everything-green/; - asks a logged-in
ghorglabCLI for its token when a GitHub or GitLab source has no token set (turn this off withauth = "none"); - runs the
token_cmdcommands from your config exactly as written, when you set any; - calls
omarchy-launch-browser,omarchy-launch-editor, andomarchy-notification-sendfor clicks, config editing, and failure notices. Only anhttp://orhttps://row URL is ever opened: the launcher hands its argument to the browser as written, so a row whose URL is anything else simply does not respond to a click.
Limits
Nothing a server or a configured command sends to a bundled provider is read
without a bound, so a host that answers with an endless body cannot make the
collector grow until the session dies. A timeout alone does not cover this: it
limits the gap between two chunks, not the total, so a host that drips one
byte at a time never trips it. (Provider plugins get these bounds by calling
ctx.get_json, which is where they live; a third-party plugin that reaches
for the network itself is on its own.)
The size is enforced while reading, not from what the server declares: a
chunked response declares no length, and a hostile host can under-report a
Content-Length anyway.
| Bounded | Cap |
|---|---|
| One HTTP response | 256 KiB, and a total deadline as well as a socket timeout |
| One cached response body | 64 KiB |
| A cache file | on read, derived from the entry caps so a full cache always fits, then the newest 200 entries |
| A cache entry's age | 24 hours since it was last used |
| Your config file | 4 MiB |
token_cmd output, token_file |
64 KiB, and the command is killed with its process group |
[[sources]] entries watched |
the first 200 |
| A row's label / branch | 120 bytes |
| A row's detail or error message | 240 bytes |
| A row's id | 200 bytes |
| A row's URL | 1 KiB, http(s) only — a longer one is dropped, never cut |
| The config hint | 400 bytes |
| The whole snapshot | ~430 KiB — a consequence of the field caps, not a separate check |
The response cap is sized from what the APIs actually send: the largest body seen in a live cache was 15 KiB.
The row caps are a separate concern from the response cap: the collector exits after every tick, but the bar holds the parsed snapshot for the whole session, so what one 256 KiB response is allowed to become matters as much as the response itself. Every string a source contributes is flattened to one line, capped, and rendered as plain text — so markup in a pipeline name stays visible as markup rather than being drawn as markup.
Update or remove
omarchy plugin update jellyfrog.everything-green
omarchy plugin remove jellyfrog.everything-green
Development
omarchy plugin validate .
python3 -m unittest discover -s tests -v
/usr/lib/qt6/bin/qmlformat -n BarWidget.qml Panel.qml
Providers that would fit well here: Woodpecker/Drone, Buildkite, CircleCI,
Azure Pipelines, Flux CD. Each one is a single small file in providers/.