
Internet Latency for Omarchy
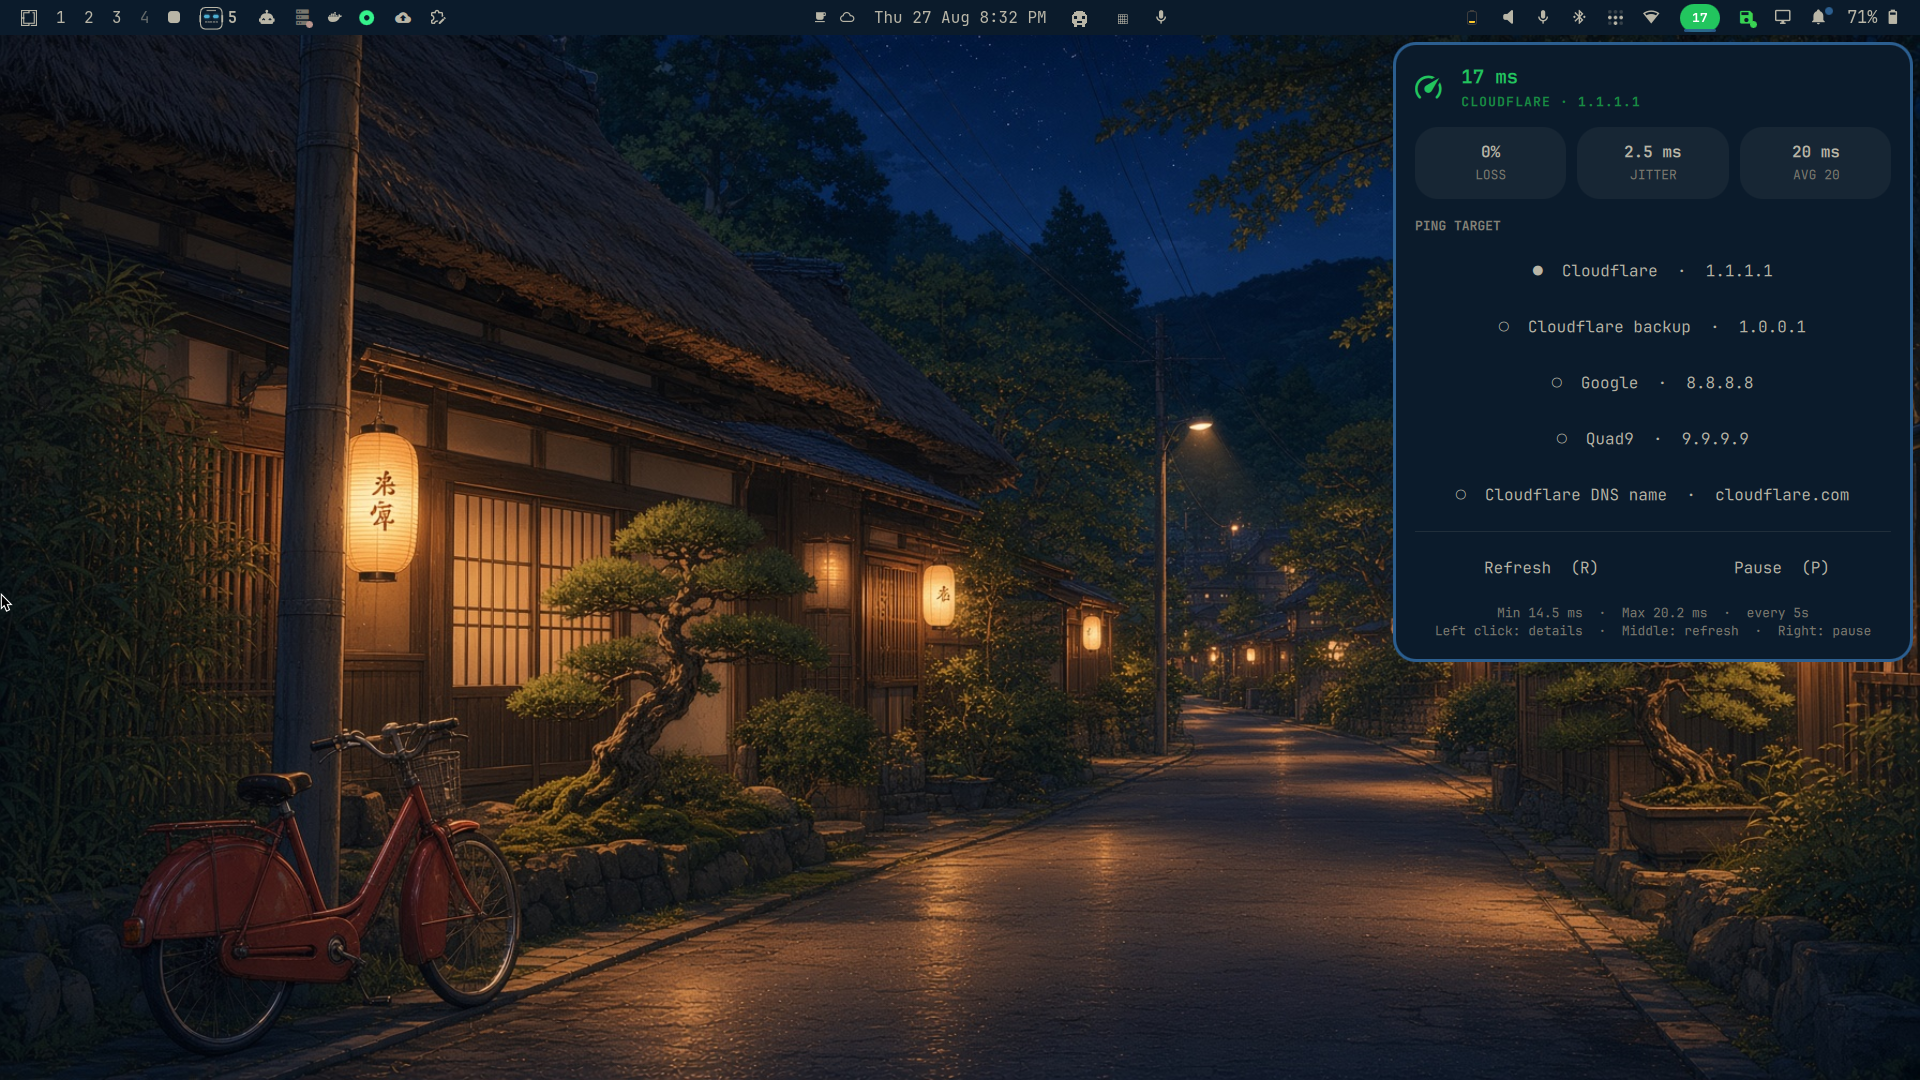
A live, numeric internet latency meter for the Omarchy top bar. The number is the current ping in milliseconds and changes color at a glance:
- Green: under 50 ms
- Yellow: 50–119 ms
- Red: 120+ ms or offline
Click the number for a diagnostic panel. It includes target switching, packet loss, jitter, rolling average, min/max latency, pause/resume, manual refresh, and a 20-sample history.
Install
omarchy plugin add https://github.com/nixfred/omarchy-internet-latency.git --enable
Or, for local development:
./install.sh
The development installer symlinks this checkout into ~/.config/omarchy/plugins/, validates it, and places the widget before Omarchy's network icon.
Remove
Remove a normal marketplace or git-managed installation with:
omarchy plugin remove nixfred.internet-latency --yes
For a local development symlink, the bundled helper performs the same removal:
./uninstall.sh
Use
- Left click: open the detail panel and choose Cloudflare, Google, Quad9, or another preset.
- Middle click: refresh immediately.
- Right click: pause or resume monitoring.
- In the panel: press
Rto refresh orPto pause/resume.
The default target is Cloudflare 1.1.1.1, sampled every five seconds with three ICMP packets. Every probe has a hard deadline so a broken resolver cannot stall monitoring. Configure the interval, thresholds, and a custom host through the Omarchy bar widget settings. Host input is restricted to safe hostname/IP characters before it is passed to ping.
IPC is also available:
omarchy-shell nixfred.internet-latency status
omarchy-shell nixfred.internet-latency refresh
omarchy-shell shell summon nixfred.internet-latency '{}'
Requirements
- Omarchy Shell with third-party bar-widget support
pingfromiputils
Development
omarchy plugin validate .
node tests/test_model.js
qmlformat -n BarWidget.qml
Plugin files hot-reload while installed. Force discovery with omarchy-shell shell rescanPlugins if needed.
License
MIT