
Omahub
← All plugins
S

System Stats

by Saif Omar

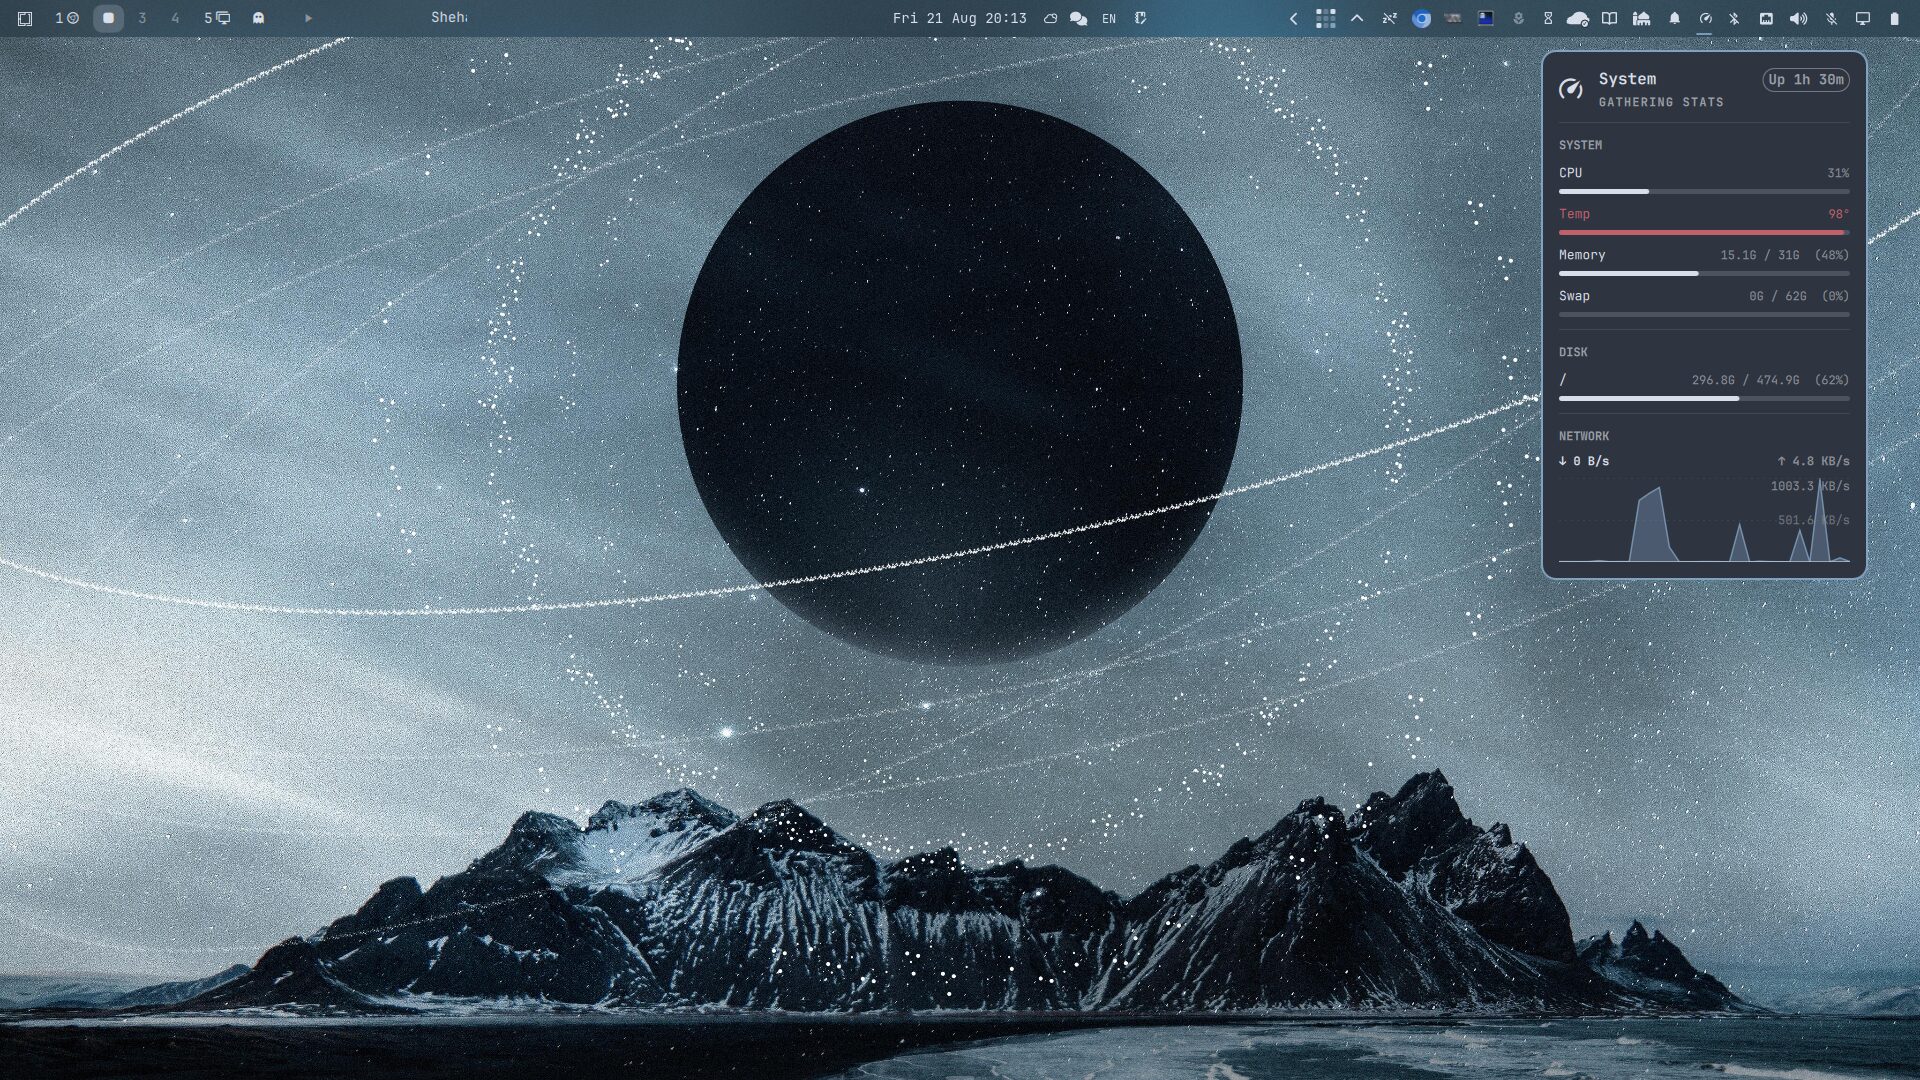
CPU, temperature, memory, disk, uptime, and live network monitor with usage bars, history graphs, and a btop launcher

Security review

No obvious issues detected

Deterministic scan — not a security guarantee

None
Risk level
None
Analyzed commit
1eb9492
Scanned
1 month ago

No potentially dangerous behavior detected in the analyzed commit.

Automated analysis only — not a security guarantee.

AI advisory review

No obvious issues detected

Language-model assessment · ~deepseek/deepseek-v4-flash-latest — advisory only

None
AI risk level
None
Recommendation
install
Model
~deepseek/deepseek-v4-flash-latest
Analyzed commit
1eb9492
Reviewed
1 month ago

This plugin is a read-only system monitor: the Python helper samples /proc and /sys files and emits JSON, and the QML widget renders usage bars and graphs. There is no obfuscation, no persistence, no credential handling, no network access, and no destructive behavior. The only command execution is launching btop on an explicit right-click, which is documented user-initiated behavior.

How this check works

This review combines the deterministic scan (the rule-based results above) with an independent look at the plugin's code by a language model. The model reads a trimmed sample of the repository's files, the manifest, and the README, then gives a plain-language risk level and a recommendation: install (no notable danger), review (look closer first), or avoid (clearly dangerous).

It runs on the same analyzed commit as the deterministic scan and is strictly advisory — it is not a security guarantee and never blocks a plugin by itself. A human moderator still reviews plugins before they are listed.

AI advisory only — automated analysis, not a security guarantee.

Install
$ omarchy plugin add https://github.com/SaifOmar/SystemStats --enable
System #bar #quickshell #system

System Stats

A bar-widget plugin for the Omarchy shell that shows a system monitor popup with live CPU, temperature, memory, swap, disk, uptime, and network usage. Usage is shown as horizontal bars; CPU and network throughput as btop-style scrolling graphs with labeled scale gridlines. Click to pin the popup, middle-click to refresh, right-click to launch btop.
preview

Requirements

  • Omarchy (Quattro) running on Hyprland
  • Python 3 (used by sys-stats.sh to read /proc/stat, /proc/meminfo, /proc/mounts, /proc/net/dev, and /sys/class/hwmon)

Installation

From the repository root:

omarchy plugin add https://github.com/SaifOmar/SystemStats.git --enable

Then add it to your bar:

omarchy bar plugin add saif.system-stats

The plugin is installed and validated by Omarchy itself; no manual copying required.

Usage

  • Left-click — pin / unpin the popup
  • Middle-click — refresh the stats immediately
  • Right-click — launch or focus btop

Settings

Per-widget overrides live in your bar layout entry in ~/.config/omarchy/shell.json:

{
  "id": "saif.system-stats",
  "refreshMs": 2000,
  "historySeconds": 60,
  "showDisks": true,
  "showNetwork": true
}
Key Default Description
refreshMs 2000 Sampling interval (min 500). Also sets the graph time scale.
historySeconds 60 How much history the graphs keep (min 10). Memory use stays flat regardless.
showDisks true Show/hide the DISK section.
showNetwork true Show/hide the NETWORK section.

Network speed tracks the interface owning the default route, so VPN tunnels (Tailscale, WARP, ...) are not double-counted.

Removal

omarchy plugin remove saif.system-stats

License

MIT. See LICENSE.