Activity Monitor
Third-party Omarchy bar plugin for a fast system overview and an expandable process monitor. It is self-contained under the user plugin directory, so normal packaged Quattro updates do not replace it.

Install
omarchy plugin add https://github.com/stappmus/omarchy-activity-monitor.git --enable
Enable or disable it through Setup > Plugins, or use:
omarchy plugin enable stappmus.activity-monitor
omarchy plugin disable stappmus.activity-monitor
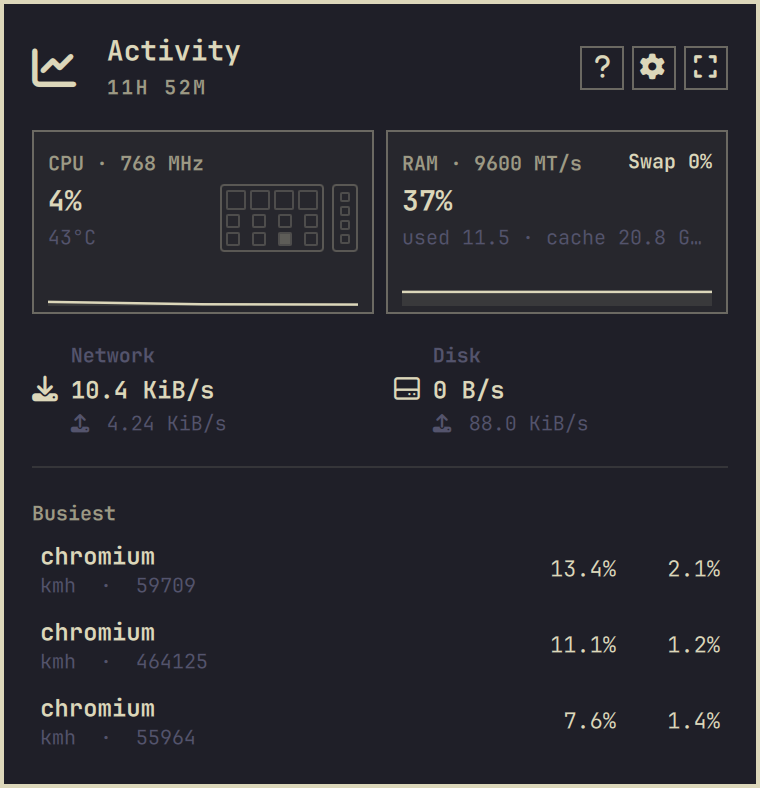
The compact panel shows CPU, memory, network and disk activity plus the three
busiest processes. CPU and RAM card headings include the current average CPU
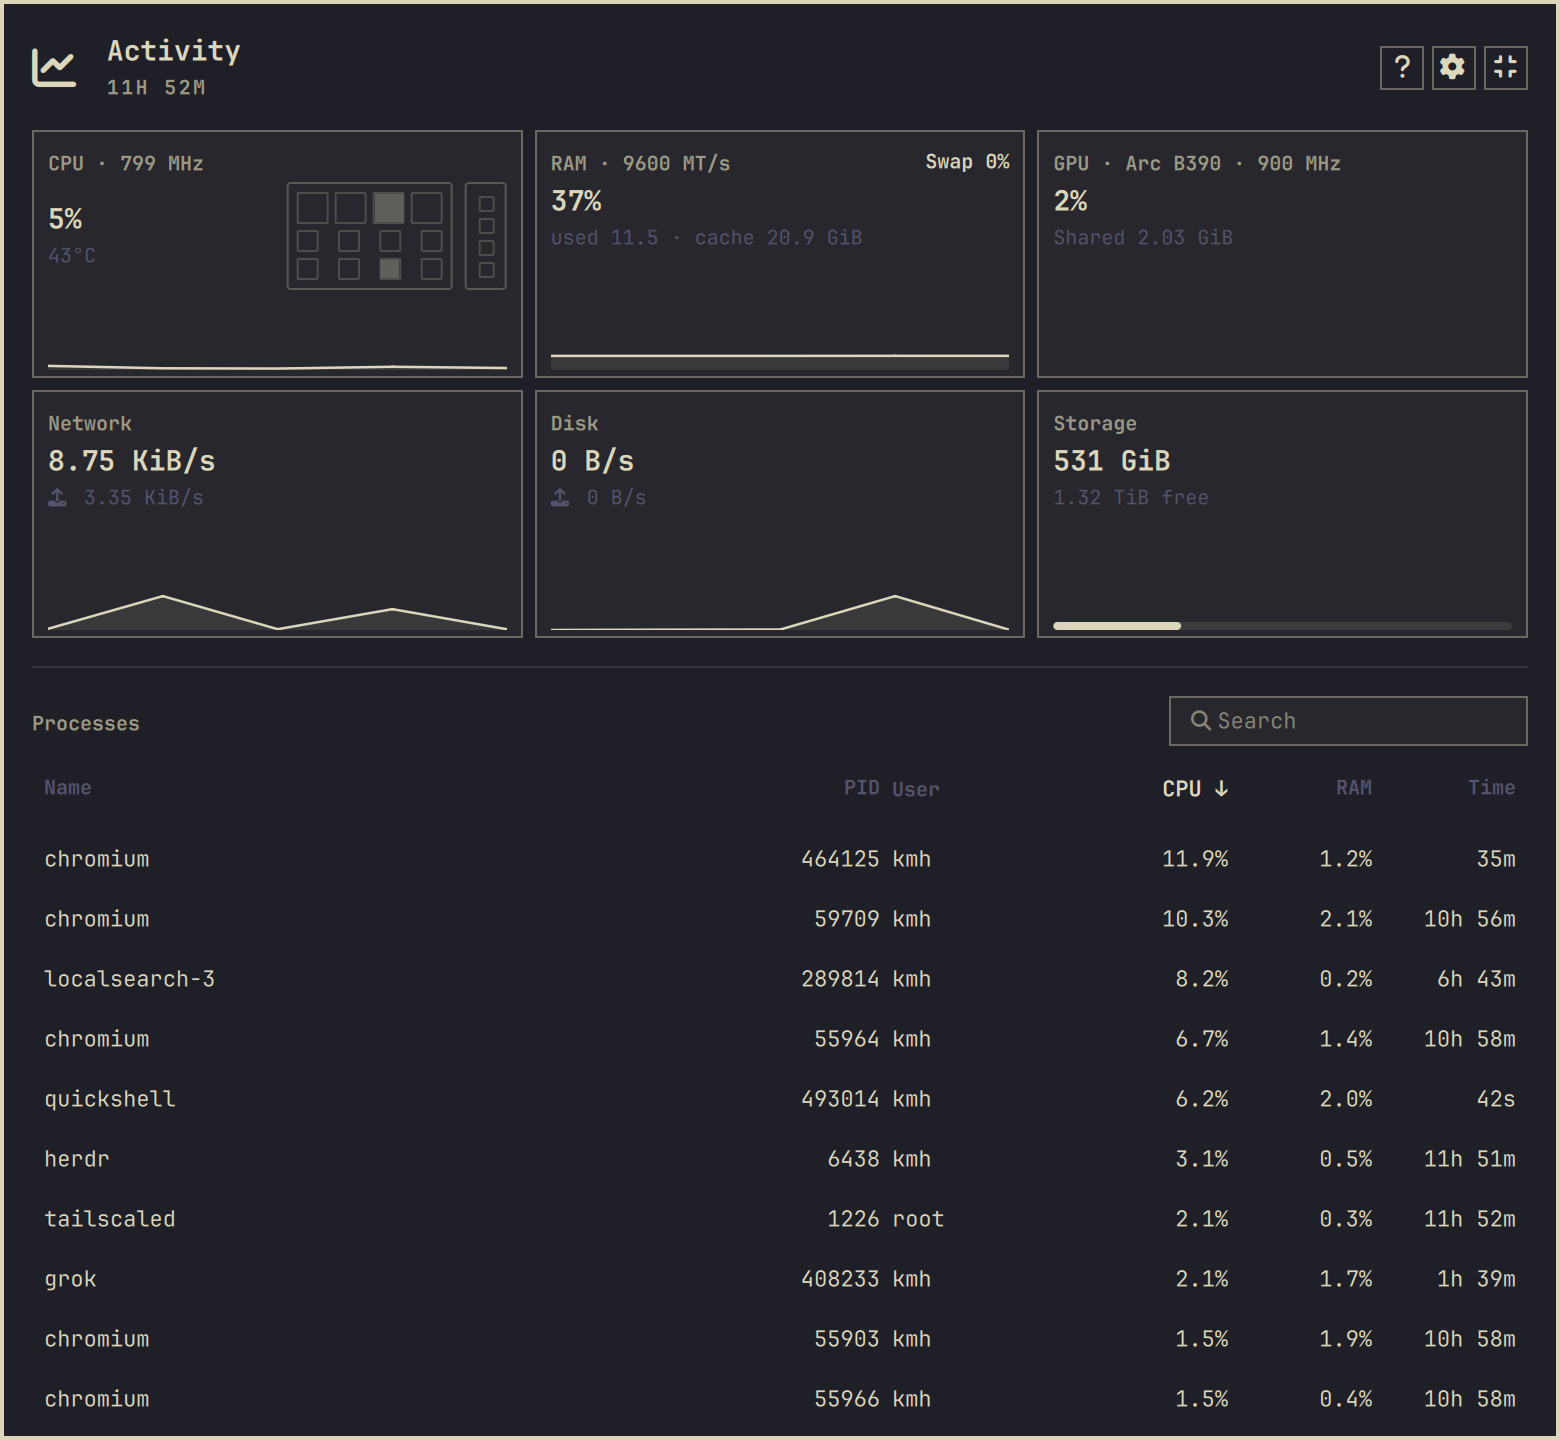
clock and configured DDR transfer rate. Expand it with the button or e for
per-core activity, memory and reclaimable cache, a swap badge in the disk
activity card, disk storage used and remaining, GPU utilization, graphics
clock and memory, search, process sorting, estimated CPU-package watts, and a
larger process list. Your own apps can be asked to close from the expanded
view after a confirmation.
CPU and GPU clocks are shown in MHz. DDR memory is shown in MT/s because DDR
transfers data twice per clock cycle; its marketed speed is a transfer rate,
not a clock frequency. A GPU clock reported as zero while the graphics engine
is fully power-gated is shown as IDLE, and measurements that the kernel or
firmware does not expose are omitted instead of estimated.
The RAM USAGE card shows used memory and cache together. Used memory follows
Linux's available-memory accounting: (MemTotal - MemAvailable) / MemTotal.
Cache is Cached + SReclaimable, matching free's cache column. Linux can
reuse that cache automatically when applications need RAM, so it is not an
extra amount to add to used memory.
The gear button (or s) opens settings inside the panel. Preferences are
applied immediately and saved with the bar layout: update speed, graph history,
Celsius or Fahrenheit, hardware-speed labels, the default compact/detailed
view, and per-process power estimation. Efficient, Balanced, and Fast
sample core resources every 3 seconds, 1.5 seconds, and 0.75 seconds
respectively; slower-changing process, GPU, thermal, and storage readings use
proportionate cadences.
The GPU square lists up to two adapters separately. NVIDIA and discrete AMD
cards show used/total VRAM when their drivers expose it. Integrated GPUs show
SHARED: the reported system-memory allocation currently resident for
readable desktop GPU clients. Shared GPU memory is part of RAM and grows
dynamically, so the panel deliberately shows the amount in use without
inventing a fixed GPU memory total. Intel/Xe and compatible drivers use
standard DRM client counters; AMD uses its kernel busy/VRAM counters, and
NVIDIA uses NVML from the installed driver. Missing measurements remain visibly
unavailable.
The expanded CPU card shows the measured total CPU-package watts. Individual process rows show their estimated share of that total.
Keyboard shortcuts in the expanded view:
j/k: select a process/: searchc/m/w/p/t/n: sort by CPU, memory, estimated watts, PID, runtime, or nameh/l: cycle sort columnsr: refreshs: open settingsx: confirm closing the explicitly selected appeorEsc: collapse
The widget keeps one stdin-driven native stats reader alive only while its panel is open. Resource, process, temperature, GPU, and storage requests retain their independent refresh cadences without repeatedly launching collectors. One single-shot deadline scheduler coalesces due work instead of maintaining a recurring UI timer per metric. GPU sampling runs only while the advanced view is expanded, and energy sampling additionally respects its settings toggle. Closing the panel stops all readers but retains the last valid display values; reopening shows those immediately while fresh counter baselines are collected over 300 ms.
The native reader accesses procfs and sysfs directly and launches no child
collectors. It caches static CPU, disk, thermal, GPU, user, and process identity
metadata. Current process counters are still read on every process sample, but
the expensive scan for DRM client file descriptors runs only every ten seconds
and already-discovered GPU counters continue updating between scans. NVIDIA's
management library is loaded once per panel session rather than starting
nvidia-smi for every sample. No monitoring daemon runs while the panel is
closed.
App actions use a PID file descriptor plus the sampled process start time, resolve worker processes to a verified same-user app ancestor, reject foreign and protected processes, and never invoke a shell or privilege prompt. The confirmation discloses that an app still running after a three-second graceful close window will be force-closed.
EST. W is an interval estimate (three seconds in Balanced mode): measured
RAPL CPU package energy is assigned by each process's CPU-time share. It is
intentionally marked with ~ because Linux exposes energy for hardware
domains, not individual processes. Package coverage is processor-specific and
can include cores, uncore, integrated graphics, and on-chip interfaces; it does
not represent wall, display, storage, network, or audio power. Energy sampling
runs only while the advanced view is expanded. The plugin reads RAPL directly
when the kernel exposes it to the user. On systems where RAPL is root-only, an
optional root-owned companion helper may be installed; the plugin never opens
a privilege prompt while sampling. Unsupported hardware or an unavailable
reader shows —. Turning off process power estimates removes the column and
stops the energy reader entirely.
Optional root-only RAPL reader
The base plugin needs no package or elevated access. If your kernel exposes RAPL energy counters only to root, build the optional helper package:
git clone https://github.com/stappmus/omarchy-activity-monitor.git
cd omarchy-activity-monitor
makepkg --cleanbuild --install
That package compiles and installs one immutable native collector copy plus one
narrow sudoers rule which permits only its power-reader mode. The panel uses
sudo -n, so it never opens a password prompt. Remove it independently with:
sudo pacman -Rns omarchy-activity-monitor-power-helper
Structure
Panel.qmlowns layout, keyboard/pointer interaction, selection, and sorting.ActivityController.qmlowns reader processes, framing, the coalesced deadline scheduler, watchdogs, fresh-baseline handling, derived samples, and the explicit user/root power-reader state.ProcessActionController.qmlowns confirmation state and guarded helper execution for app actions.Model.jscontains snapshot factories, parsers, calculations, formatting, sorting, and side-effect-free UI policy helpers.activity-sampler.cppis the unified native Linux collector; the checked-inactivity-samplerexecutable is reproducibly built from it withmakefor Omarchy's x86-64 platform.
Resource, thermal, GPU, storage, package-energy, and derived-metric models remain separate rather than being merged into a catch-all snapshot. The QML action policy only provides immediate feedback; the plugin-local signal helper always revalidates live procfs identity, ownership, state, and protection before it signals anything. All helpers live at the plugin root and are addressed by absolute plugin-relative paths, avoiding dependence on Omarchy's packaged command tree.
Remove
omarchy plugin remove stappmus.activity-monitor
Test
make -B activity-sampler
./test/all.sh
qmllint -I /usr/share/omarchy/shell ActivityController.qml Panel.qml ProcessActionController.qml Sparkline.qml
omarchy plugin validate .
makepkg --verifysource
Licensed under the MIT License. The panel began as an Omarchy activity-panel implementation and is maintained as an independent plugin by Kristoffer Haugland.