
System Metrics
English · Português (Brasil)
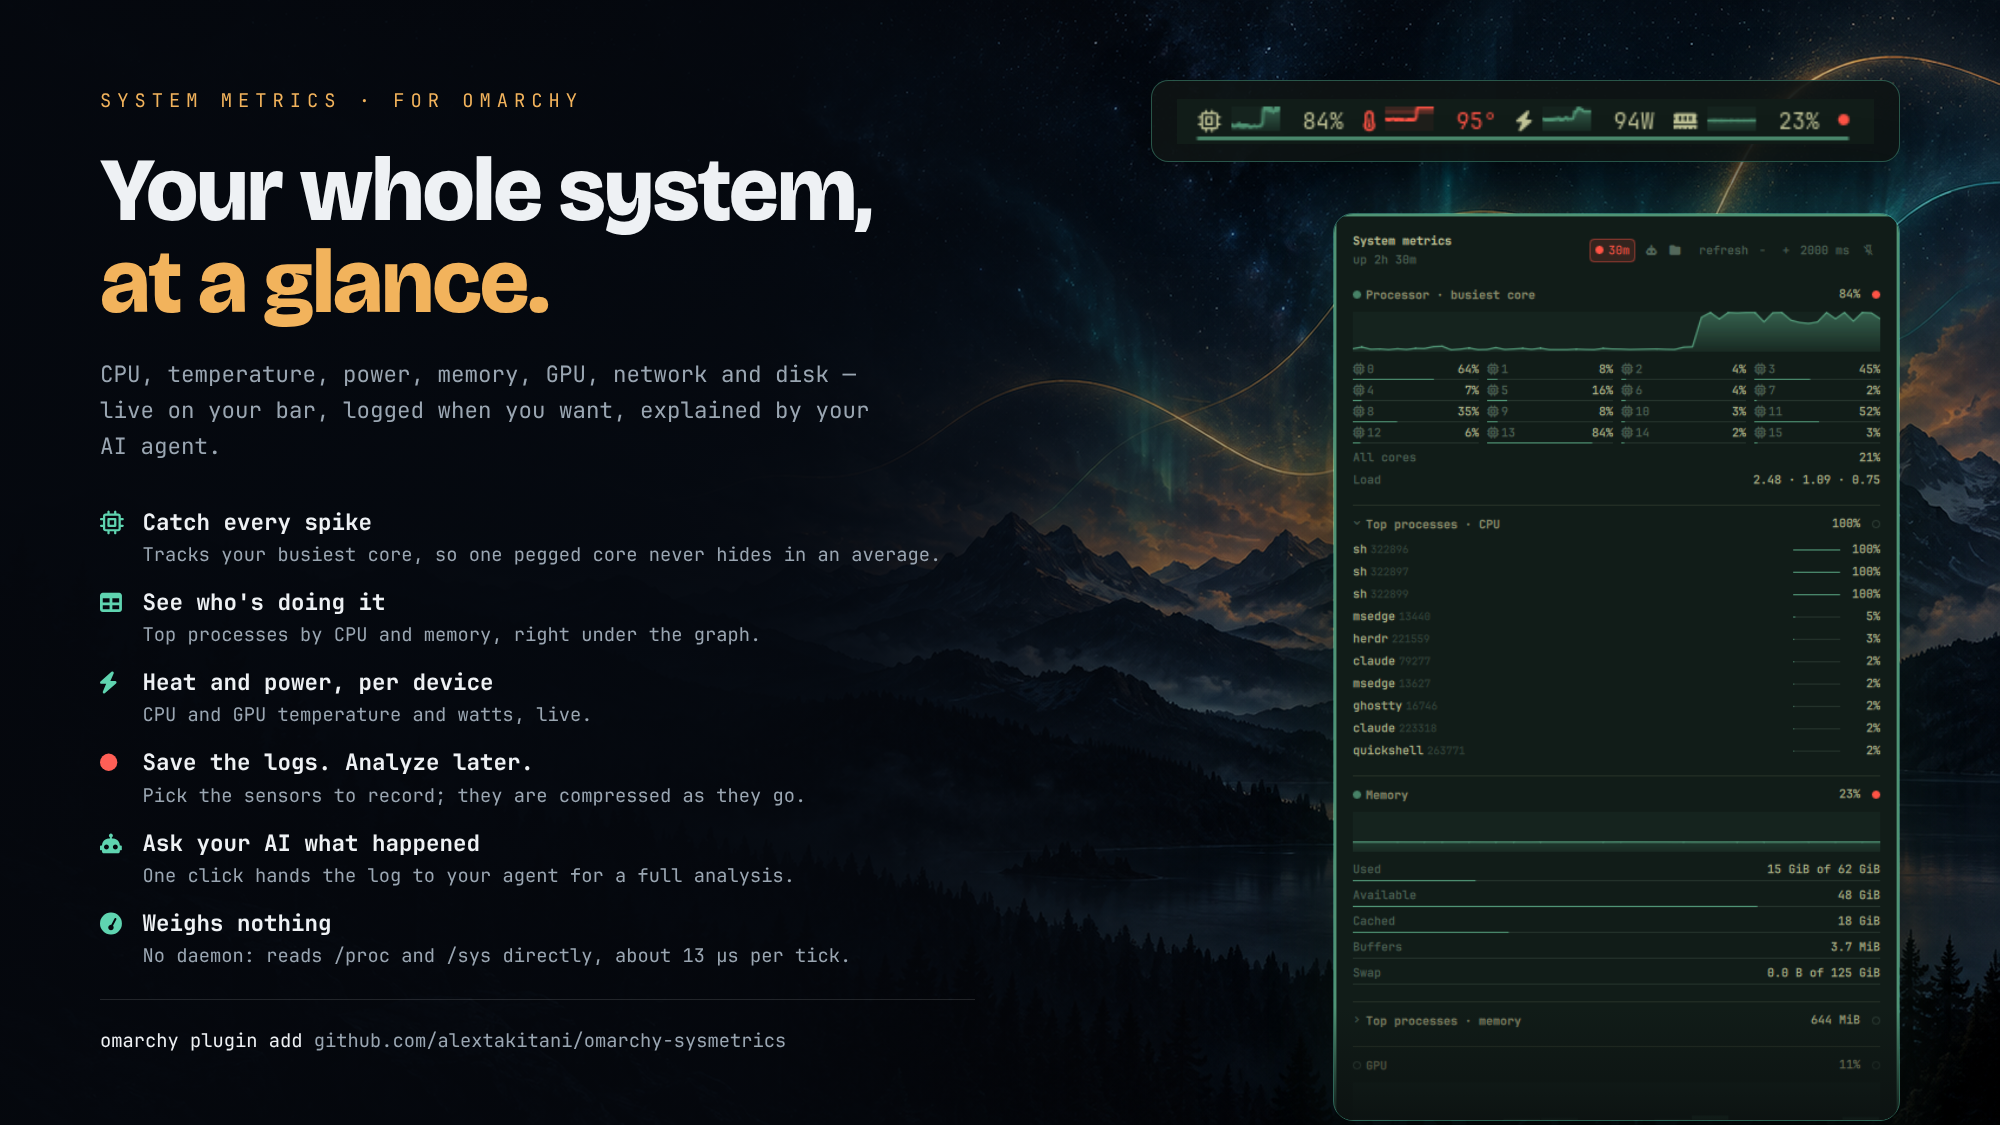
A bar widget for the Omarchy shell: a strip of live system gauges, and a popup with the detail behind them.
Readings come straight from /proc and /sys — there is no monitoring daemon
to install, and nothing to configure to get started.

It costs almost nothing to run
A system monitor that measures load should not be a meaningful source of it. Out of the box this one samples CPU and memory every two seconds, and that whole cycle is two file reads and about 13µs of parsing — roughly a thousandth of a percent of one core.
That number comes from what the widget does not do:
- No subprocesses on the recurring path.
/procand/sysare read directly through the shell's own file API. Shelling out toawk,ps, orsensorson a timer means forking an interpreter every tick, which costs milliseconds of real CPU — hundreds of times more than reading the same file, and it recurs forever. Two readings genuinely cannot be had that way, and both are fenced off. Filesystem capacity comes fromstatfs, which/procdoes not carry: a singlesh -c "df … | head -c 65536"pipeline, every fifteenth tick, only while Storage is being shown. The process lists need one/proc/<pid>/statper process, which the shell's file API cannot glob: oneawksweep, and only while a list is actually expanded — a popup merely being open pays nothing. Nothing else forks. - Nothing is sampled unless it is being looked at. With the popup shut, only the metrics you pinned to the bar cost anything; the rest are idle. Open the popup and the gauges all sample, because every section needs live data. Close it and they stop. The two process lists are gated one step finer still: they sample only while their own section is expanded, so a popup that is merely open never pays for a sweep.
- Each gauge repaints on its own samples. A CPU sample redraws the CPU gauge, not the network one. That sounds obvious, but the naive version — one "something changed" counter — makes N gauges repaint N times per tick, and a canvas repaint is far more expensive than the sample that triggered it.
- Readings are bounded. Mount tables and interface lists are inputs whose
size someone else controls, so every recurring reader has a byte, row, and
name-length ceiling, and discards input that overruns it rather than parsing
a torn row. A hostile
/proccannot turn the widget into a memory leak inside your shell.
The last two matter more than they look: this runs inside the shared Quickshell process that draws your whole desktop. Anything wasteful here is not a widget misbehaving, it is your bar stuttering.
None of this is asserted on faith — the numbers above are measured, and the
bounds and gating are covered by the test suite (tests/run), including a
smoke test that runs the real widget inside a real quickshell.
What it shows
Eleven metrics, each of which you choose to show on the bar or keep in the popup:
| Metric | On the bar | In the popup |
|---|---|---|
| CPU | busiest core | per-core grid, all-core average, load average |
| CPU temperature | banded line | sensor reading with threshold |
| Memory | used %, swap as a second line | used / available / cached / buffers / swap |
| GPU | busy % | busy meter |
| VRAM | used % | used of total |
| GPU temperature | banded line | die reading |
| Storage | fullest filesystem | every filesystem, used of total |
| Network | download and upload | per-direction rates, interface |
| Disk I/O | read and write | per-device read and write rates |
| CPU power | package watts | watts over time |
| GPU power | board watts | watts over time |
The CPU gauge plots the busiest core, not the average across all of them.
The kernel's aggregate averages every core, which hides the load people
usually want to see: on a 16-core machine one core pegged at 93% reads as 7%
aggregate, so a compile barely moves the graph. cpu.urgent is compared
against the same number. The all-core average is still shown, in the popup.
Which process is doing it
The gauges say the machine is busy; two lists in the popup say what is making it busy. Top processes · CPU sits directly under the CPU charts, and Top processes · memory under the memory meters — each one breaking down the reading above it. Both are collapsed until you click their heading.
They are the only sections that cannot be pinned to the bar (ten rows of process names do not belong on a strip), so their headings carry a disclosure caret instead of a pin dot. Each row is a process name, its pid, and the reading it is ranked by.
The CPU column is what each process used since the previous sweep, not the
lifetime average ps prints as %CPU. They answer different questions: a
process that ran hot for an hour and has since gone idle tops the lifetime
list forever, which is exactly the row nobody wants there. It is a percentage
of one core, so a threaded process passes 100% — the same reading top gives.
Expect a dash on the first tick after expanding: with only one sweep there is
no interval to measure against, and inventing a number there would be a lie.
The memory column is RSS, which double-counts pages shared between processes, so the rows do not sum to the machine's used memory; they answer which process is holding the most.
Clicking the strip opens the detail view, which is also where you choose what the bar shows:
<img src="docs/popup.png" alt="The detail popup" width="420">Install
omarchy plugin add https://github.com/alextakitani/omarchy-sysmetrics.git --enable
That is the whole installation: the widget places itself on the right of the bar and starts with CPU and memory. Everything else is optional — you can add or remove metrics by clicking their headings in the popup, and never touch a config file.
To place it somewhere else:
omarchy plugin enable takitani.sysmetrics --section center # or: --before omarchy.clock
Removing it
omarchy plugin remove takitani.sysmetrics
That takes the widget off the bar and deletes the plugin. To keep it installed
but hide it, omarchy plugin disable takitani.sysmetrics instead.
Using it
- Click the strip to open the popup.
- Click a section heading in the popup to add or remove that metric from the bar. A filled dot means it is on the bar, a hollow one means it lives only in the popup.
- Pin (top right of the popup) keeps the popup open instead of dismissing it on the next click elsewhere.
- refresh − + adjusts the poll interval, from 500ms to 15s.
- Middle-click the strip forces an immediate sample.
Every section is present in the popup whether or not its metric is on the bar, so a metric you have hidden is still reachable to bring back.
Power
Two metrics, one per device, so each is pinned, plotted and logged on its own:
CPU power is the package, from RAPL's energy counter, and GPU power is
the card, from its driver's power sensor (power1_average on amdgpu). The
rest of the board, the drives and the fans are not metered, so the two
together are less than the draw at the wall.
The GPU reading works out of the box. The CPU package does not: the kernel
makes RAPL's energy_uj readable by root only, and the popup says so until
you grant access. It is locked down because fine-grained energy readings can
leak information about what other processes are computing (the PLATYPUS
attack), which matters on a shared machine and far less on a single-user
desktop. If that trade-off is fine for you, a udev rule opens it for reading:
echo 'ACTION=="add", SUBSYSTEM=="powercap", KERNEL=="intel-rapl:*", RUN+="/usr/bin/chmod 0444 /sys%p/energy_uj"' \
  | sudo tee /etc/udev/rules.d/60-rapl-energy-read.rules
sudo udevadm trigger --subsystem-match=powercap --action=add   # apply now, no reboot
The widget retries the read every tick, so CPU power appears within a couple of seconds, with no shell restart. To undo it, delete the rule and reboot.
What the CPU figure covers: the RAPL package domain (intel-rapl:0), which
is the whole processor — every core plus the shared parts of the chip (L3,
memory controller, interconnect). Not the motherboard or its voltage
regulators.
On AMD too, despite the name. RAPL is an interface Intel introduced and
AMD implements from Zen onward; the kernel serves both through its
intel_rapl driver, so AMD CPUs show up as intel-rapl as well. On AMD the
reading comes from the chip's own power model rather than a measurement on
the supply rails, so it is good for trends and peaks, not metering-grade.
Recording
The popup can log readings to disk for later analysis — a day's CPU and temperature, and which processes were behind them.
- The red marker at the right of each section heading chooses whether that reading is logged, independently of whether it is on the bar. The two process lists share one marker. Until you touch them, a recording logs whatever is pinned.
- rec (top of the popup) starts and stops a recording. While one runs it shows its duration, and the strip carries a red dot, because a recording keeps its metrics sampled with the popup shut.
- A recording survives a shell restart: it resumes into a new pair of files.
- The folder button beside rec opens the folder the recordings are written to.
- Once there is a recording, a robot button hands it to your default
agent (
omarchy agent prompt), started in the logs folder with a prompt that explains the files and asks for averages, peaks, the processes behind them and the energy used. A running recording is flushed first, so the agent sees everything up to the click.
Files go to $XDG_STATE_HOME/omarchy-sysmetrics/logs/ (normally
~/.local/state/…), named by start time:
<stamp>-metrics.csv.zst— one row per sampling tick:t_ms(unix ms) plus the chosen columns (cpu_max_pct,cpu_avg_pct,cputemp_c,mem_pct,swap_pct,gpu_pct,vram_pct,gputemp_c,net_rx_Bps,net_tx_Bps,disk_read_Bps,disk_write_Bps,storage_pct,cpu_w,gpu_w). A missing reading is an empty field, not 0.<stamp>-processes.csv.zst— every 30 seconds, the five processes that used the most CPU and the five holding the most memory in that window:t_ms,pid,comm,cpu_s,rss_bytes.cpu_sis CPU time spent in that window, so summing it gives each process's total.
Each file is written by one long-lived writer fed over a pipe, so a tick costs
one line written to a pipe — no file reopened. Once a minute the rows so far
are sealed into a zstd frame, appended to the file and fsynced, so a crash of
the whole machine loses at most the last minute. At the default interval that
is under 1 MB a day. Stopping the recording, or restarting the shell, flushes
everything. Apart from that per-minute zstd, the process sweep is the only
fork, once per window.
Reading it back, for example with DuckDB:
-- temperature over the day
SELECT avg(cputemp_c), max(cputemp_c), quantile_cont(cputemp_c, 0.95)
FROM 'logs/*-metrics.csv.zst';

-- who burned the CPU
SELECT comm, round(sum(cpu_s) / 60, 1) AS cpu_minutes
FROM 'logs/*-processes.csv.zst' GROUP BY comm ORDER BY 2 DESC LIMIT 10;
Configuration
The popup covers the common cases (which metrics show, how often they refresh),
so this is only needed for the settings it does not expose. Add the keys you
want to the widget's entry in ~/.config/omarchy/shell.json:
{
  "id": "takitani.sysmetrics",
  "metrics": ["cpu", "memory"],   // any subset, in any order
  "logMetrics": ["cpu", "cputemp", "processes"],  // what a recording logs
  "recording": false,             // the rec button; persisted across restarts
  "intervalMs": 2000,             // 500–60000 (the popup stepper goes to 15000)
  "historyLength": 60,            // samples kept per metric
  "sparklineWidth": 34,           // px per gauge plot, 12–200
  "showSparkline": true,          // false: values and icons only, no plots
  "showValue": true,
  "showIcon": true,
  "cpu":         { "urgent": 90 },   // compared against the busiest core
  "memory":      { "urgent": 90 },
  "gpu":         { "card": "auto", "urgent": 95 },
  "storage":     { "urgent": 90 },
  "network":     { "interface": "auto", "minCeiling": 65536 },
  "disk":        { "devices": "auto", "minCeiling": 1048576 },
  "cputemp":     { "sensor": "auto", "range": [30, 95], "urgent": 85 },
  "gputemp":     { "sensor": "auto", "range": [30, 95], "urgent": 85 }
}
"auto" resolves at runtime: the GPU by its DRM driver, temperature sensors by
their hwmon name, the network interface by the default route, and disks by
excluding partitions and virtual devices. None of these are addressable by a
fixed path — DRM card numbers and hwmon indices are not stable across reboots.
showIcon, showSparkline and showValue are independent, so the strip can
be reduced to whichever parts you want — "showSparkline": false leaves a row
of plain readouts with no plots. Turning all three off leaves each gauge with
nothing to draw, so the widget falls back to the same placeholder glyph it
shows when no metric is pinned: still there, still clickable, still a way back
to the popup. A vertical bar has no strip to lay out in the first place, so it
keeps showing its single-value label. The popup keeps its charts either way.
Unknown keys are ignored and malformed values fall back to their defaults, so a bad config degrades rather than breaking.
Design notes
Two decisions are worth knowing about, because the code looks inconsistent without them:
Each metric is drawn in the form that suits it. A filled area implies a zero baseline, so temperatures — which live between about 30°C and 95°C — are drawn as an unfilled line across that band. Plotted from 0°C the entire idle-to-throttle range would occupy a couple of pixels. Network and disk are mirrored columns because collapsing two directions into one line discards half the information. GPU busy time is columns because a line interpolates activity between two idle samples that never happened.
Label widths are fixed by contract. Each label sits in a box sized by measuring a template string in the theme's own font, so the strip does not shuffle as values change — which would move click targets under the cursor. The templates come from the format contract, never from observed values.
Everything is themed through the shell's own colour tokens, so the widget follows whatever theme is active, including live theme switches.
docs/CONTRACT.md records the reasoning in full, along with the failure modes found while building it.
Requirements
Omarchy with the Quickshell-based shell and bar widget plugin support.
df (coreutils) for the Storage metric; everything else is /proc and /sys.
Changes
CHANGELOG.md records what changed in each release.
License
MIT