
Workload — neon system monitor for the Omarchy bar
A cyberpunk system monitor for the Omarchy shell. The bar shows CPU load (or temperature, or both plus GPU) at a glance; a click opens a glowing cyan → violet → hot-pink dashboard with everything else.
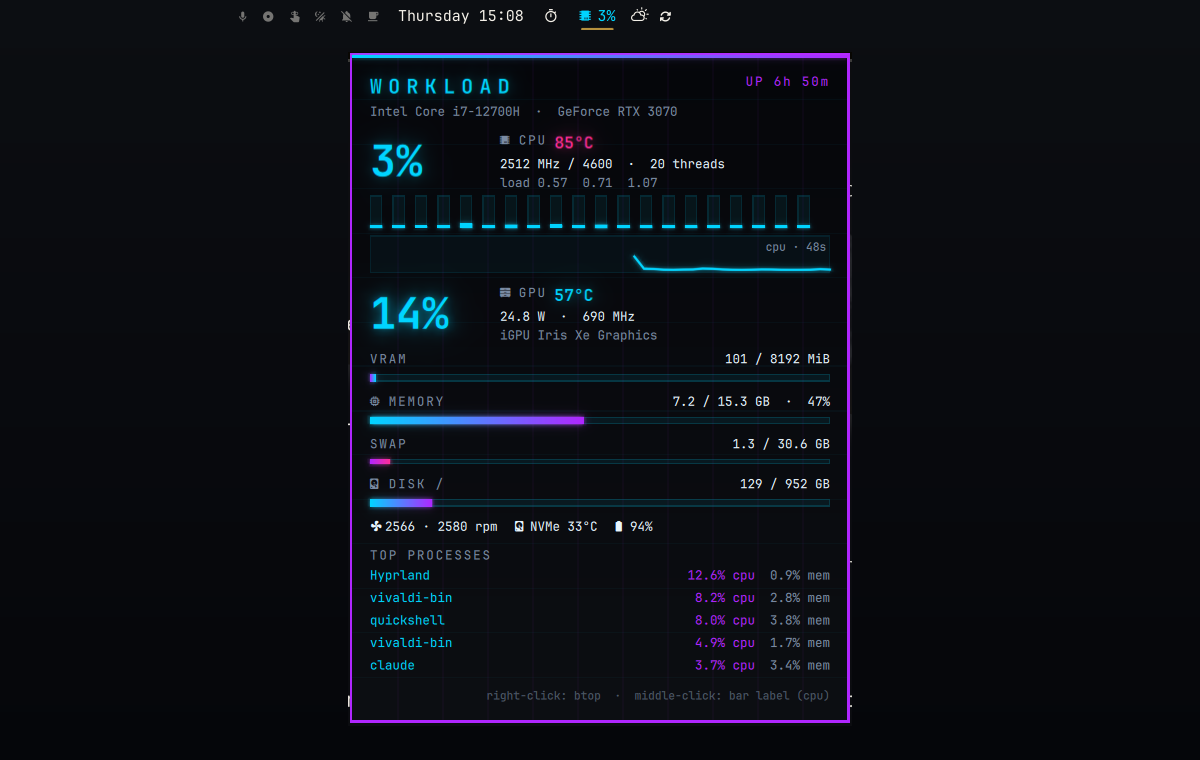
What it shows
| Section | Details |
|---|---|
| CPU | Load %, package temperature, current / max MHz, thread count, load averages, one bar per thread, and a sparkline of recent load |
| GPU | Utilisation %, temperature, power draw, clock and VRAM for a discrete NVIDIA or AMD card, plus the integrated GPU's name |
| Memory | RAM and swap usage bars |
| Disk | Usage of / |
| Sensors | Fan speeds, NVMe temperature, battery level and charging state |
| Processes | The top processes by CPU, with their CPU and memory share |
Colours shift from cyan to violet to hot pink as load and temperatures climb, so a glance at the popup tells you whether anything is struggling.
Bar widget
| Action | Result |
|---|---|
| Left click | Open / close the dashboard popup |
| Middle click | Cycle the bar label: cpu → full → temp → icon |
| Right click | Open btop in a terminal (omarchy-launch-or-focus-tui btop) |
While the popup is closed the widget samples a cheap subset every 3 seconds; with the popup open it samples everything once a second (both intervals are settings).
Requirements
- Omarchy with the Quattro shell (
omarchy-shell, Quickshell based). - Linux kernel hwmon sensors (standard on Omarchy). CPU temperature is read from
coretemp(Intel),k10temp/zenpower(AMD), or a CPU thermal zone. - Optional:
nvidia-smifor NVIDIA GPU stats, theamdgpudriver for AMD GPU stats. Without a discrete GPU the GPU section simply says so. lspci(pciutils),ps(procps-ng),df,awk,bash— all present on Omarchy.
The plugin never wakes a suspended NVIDIA or AMD GPU just to read its statistics: if the card is runtime-suspended it is left asleep and the popup shows "asleep".
Install
omarchy plugin add https://github.com/techywilbur/omarchy-workload.git --enable
--enable places the widget in the bar's center section (you can choose a
section when prompted). To add it later, or move it:
omarchy plugin enable techywilbur.workload
omarchy bar move techywilbur.workload --section right
Manual install without git management:
git clone https://github.com/techywilbur/omarchy-workload.git \
  ~/.config/omarchy/plugins/techywilbur.workload
omarchy-shell shell rescanPlugins
omarchy plugin enable techywilbur.workload
Update
omarchy plugin update techywilbur.workload
Remove
omarchy plugin remove techywilbur.workload
That deletes the plugin folder and its bar entry. The plugin installs nothing outside its own folder: the collector script ships inside the plugin and runs from there.
Settings
Settings live inline on the widget's entry in ~/.config/omarchy/shell.json
and can be edited from the Omarchy bar settings panel:
| Key | Default | Meaning |
|---|---|---|
barMode |
cpu |
Bar label: cpu, full, temp or icon |
barInterval |
3 |
Seconds between samples while the popup is closed |
interval |
1 |
Seconds between samples while the popup is open |
history |
48 |
Number of samples in the CPU sparkline |
procs |
5 |
Top processes to list (0 hides the list) |
warmTemp |
70 |
°C at which temperatures turn violet |
hotTemp |
85 |
°C at which temperatures turn hot pink |
Example entry:
{ "id": "techywilbur.workload", "barMode": "full", "warmTemp": 75, "hotTemp": 90 }
IPC
omarchy-shell workload status          # one-line JSON: cpu %, temp, mhz, mem %, gpu %, gpu temp, gpu state
omarchy-shell workload refresh         # sample now
omarchy-shell techywilbur.workload toggle   # open / close the popup (also: open, close)
How it works, and what it touches
Service.qmlrunsworkload-collector(a bash script bundled in this repository) on a timer and diffs consecutive/proc/statjiffies into CPU percentages.BarWidget.qmldraws the bar label and the popup.- The collector only reads
/procand/sys, and callsps,df,lspciand (only when the GPU is already awake)nvidia-smi. It writes nothing. - No sudo or pkexec is required. Nothing is installed outside the plugin folder.
- The only thing the plugin writes is its own widget entry in
~/.config/omarchy/shell.json, and only when you change a setting (for example by middle-clicking the bar label).
Files
manifest.json        plugin manifest (kinds: service + bar-widget)
Service.qml          sampler service, IPC target `workload`
BarWidget.qml        bar label + neon popup, IPC target `techywilbur.workload`
NeonText.qml         text with a pixel-locked neon halo (MultiEffect shadow)
NeonBar.qml          labelled meter with a cyan → violet fill and a bloom
Neon.js              palette, settings parsing, helpers
workload-collector   bash script producing one JSON snapshot (`--lite` for the bar)
License
MIT © 2026 Wilbur Lindqvist