
Battery Usage
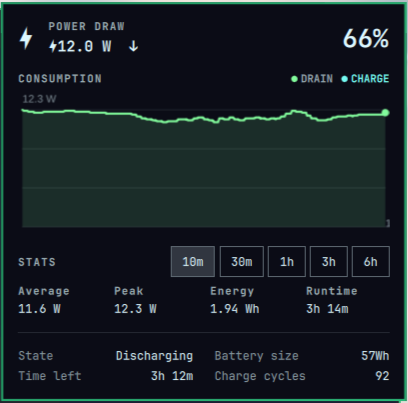
Omarchy bar widget showing the live battery draw (<watts> W). Left-click
opens a panel with a live consumption graph (drain and charge), averages,
peak, energy and battery details. Sampling history is kept in a local SQLite
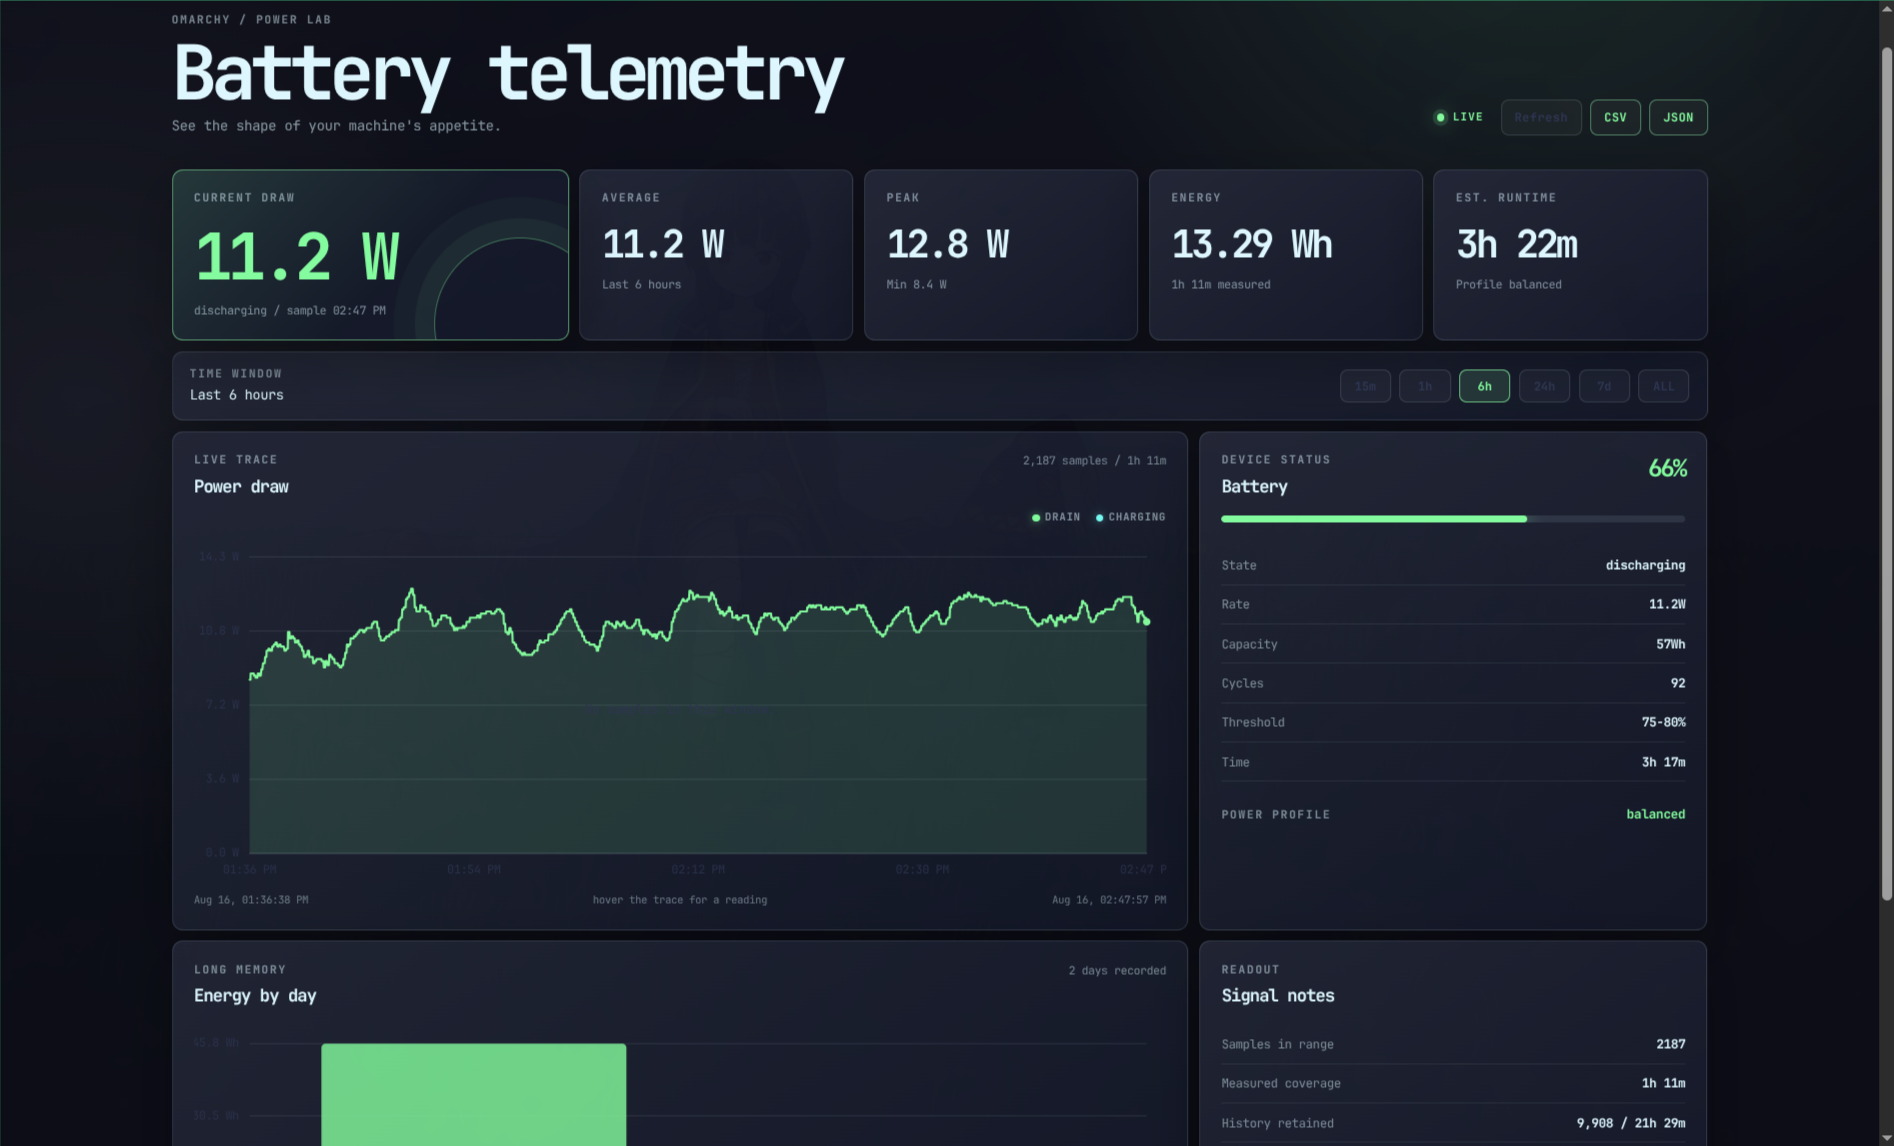
database so it survives shell restarts, and an optional web dashboard can be
enabled to browse it.
Install
omarchy plugin add https://github.com/OverStyleFR/omarchy-battery-usage.git --enable
Usage
Click the widget to open or close the consumption panel. Press Escape to close it. With the panel open, press Left/Right arrow to change the stats window scale (10m → 6h). The panel shows:
- Consumption – live graph of drain and charge over the last 10 minutes.
- Stats – average, peak and energy for a selectable window (10m to 6h), plus an estimated runtime on battery.
- Battery – state, time left / time to full, battery size and charge cycles.
The widget only shows while a battery is present and the draw is non-zero (hidden while idle on AC, kept visible while charging). Sampling cadence is 1s on AC and follows the active power profile on battery (5s power-saver, 2s balanced, 1s performance).
Configure
Move the widget in your bar:
omarchy bar move tomv.battery-usage --section right
All tunables are read from the widget settings (the shell reads the
defaults/schema declared in the manifest and merges them with your
inline shell.json entry). Set them with omarchy bar set:
| Setting | Default | Meaning |
|---|---|---|
acSampleIntervalSec |
1 | Sampling interval (s) while on AC |
batterySampleIntervalSec |
2 | Sampling interval (s) on battery with the balanced profile |
powerSaverSampleIntervalSec |
5 | Sampling interval (s) on battery with power-saver |
performanceSampleIntervalSec |
1 | Sampling interval (s) on battery with performance |
graphMinutes |
10 | Time span of the consumption graph (5–60) |
profileRefreshSec |
30 | How often the active power profile is re-read |
panelRefreshSec |
5 | How often battery details refresh while the panel is open |
Example:
omarchy bar set tomv.battery-usage batterySampleIntervalSec 3 --json
omarchy bar set tomv.battery-usage graphMinutes 15 --json
Use --json for numeric values (otherwise they are stored as strings). You
can also edit ~/.config/omarchy/shell.json directly: add the keys to the
widget's entry in bar.layout (e.g. { "id": "tomv.battery-usage", "batterySampleIntervalSec": 3 }). Restart the shell after changing them:
omarchy restart shell
Web dashboard (optional, disabled by default)
A small local dashboard (webapp/) browses the full history, daily energy
and CSV/JSON export. The server is on-demand: it starts when you open
the web app and stops again when you close its window.
~/.config/omarchy/plugins/tomv.battery-usage/scripts/battery-power-dashboard enable
This installs a Battery Usage launcher in the app menu (SUPER + SPACE). Launching it runs checks (Python, sample database, free port), starts the local server, opens the dashboard window, and stops the server when the window closes.
Manage it from the terminal (the script is also linked into $PATH on this
system):
battery-power-dashboard status    # launcher/server/database state
battery-power-dashboard enable    # install the web app launcher
battery-power-dashboard disable   # remove the launcher and stop the server
battery-power-dashboard toggle    # flip between the two
battery-power-dashboard launch    # open the dashboard now, stop on close
Server state is kept in ~/.local/state/tomv.battery-usage/ (server.pid,
server.log). Defaults to 127.0.0.1:8090; override with
BATTERY_STATS_HOST and BATTERY_STATS_PORT. It reads the same database as
the widget.
Dependencies
- Omarchy shell (
omarchy-battery-status,omarchy-powerprofiles-listare shipped with Omarchy). sqlite3CLI for sample persistence.- Python 3 (standard library only) for the optional web dashboard.
Data is stored in ~/.local/state/tomv.battery-usage/power.db.
Remove
omarchy plugin remove tomv.battery-usage
Removing the plugin does not delete the sample database.
License
MIT