
Omahub
← All plugins
O

Network Rate

by OverStyleFR

Live RX/TX rate in the bar (fixed width) with a popup ranking your top network-consuming apps.

Security review

No obvious issues detected

Deterministic scan — not a security guarantee

None
Risk level
None
Analyzed commit
fb7d3bc
Scanned
1 month ago

No potentially dangerous behavior detected in the analyzed commit.

Automated analysis only — not a security guarantee.

AI advisory review

No obvious issues detected

Language-model assessment · ~deepseek/deepseek-v4-flash-latest — advisory only

None
AI risk level
None
Recommendation
install
Model
~deepseek/deepseek-v4-flash-latest
Analyzed commit
fb7d3bc
Reviewed
1 month ago

The plugin is a network rate monitor that reads system statistics and runs standard commands like `ss` to display per-process usage. No malicious behavior detected.

How this check works

This review combines the deterministic scan (the rule-based results above) with an independent look at the plugin's code by a language model. The model reads a trimmed sample of the repository's files, the manifest, and the README, then gives a plain-language risk level and a recommendation: install (no notable danger), review (look closer first), or avoid (clearly dangerous).

It runs on the same analyzed commit as the deterministic scan and is strictly advisory — it is not a security guarantee and never blocks a plugin by itself. A human moderator still reviews plugins before they are listed.

AI advisory only — automated analysis, not a security guarantee.

Install
$ omarchy plugin add https://github.com/OverStyleFR/omarchy-network-rate --enable
System #bar #quickshell #system

Network Rate

Omarchy bar widget showing the live network rate (↓ RX / ↑ TX) in the top bar. The label keeps a fixed width so neighboring widgets never shift as the numbers change, and left-clicking opens a panel that ranks your top network-consuming apps alongside per-interface details.
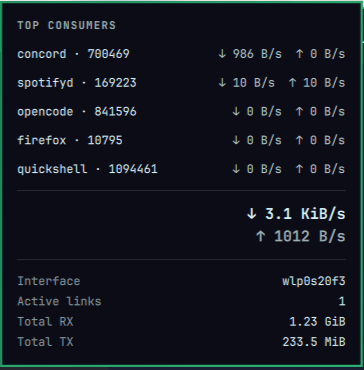
Network Rate panel

Install

omarchy plugin add https://github.com/OverStyleFR/omarchy-network-rate.git --enable

If the bar does not pick it up automatically:

omarchy restart shell

Usage

Click the widget to open or close the panel. Press Escape to close it, r to refresh. The panel shows:

  • Top consumers – the processes using the most network right now (up to 10, default 5), each with its live download/upload rate.
  • Network rate – current RX/TX throughput and the active link.
  • Totals – cumulative RX/TX bytes for the active interface(s).

The top-app list comes from ss -tanpi and only sees sockets owned by your user, so it needs no privileges.

Configure

Move the widget in your bar:

omarchy bar move tomv.network-rate --section right

The widget has a fixed width out of the box (pinned to the widest plausible reading). Adjust it per your taste:

omarchy bar set tomv.network-rate fixedWidth 0        # auto (widest plausible)
omarchy bar set tomv.network-rate fixedWidth 170      # explicit px
omarchy bar set tomv.network-rate topAppsCount 5      # apps shown in the popup
omarchy bar set tomv.network-rate refreshIntervalSec 1

Remove

omarchy plugin remove tomv.network-rate

Dependencies

  • ss from iproute2 (default on Omarchy) for the top-app ranking.
  • No external services, no root, no second Quickshell process.

License

MIT — see LICENSE.